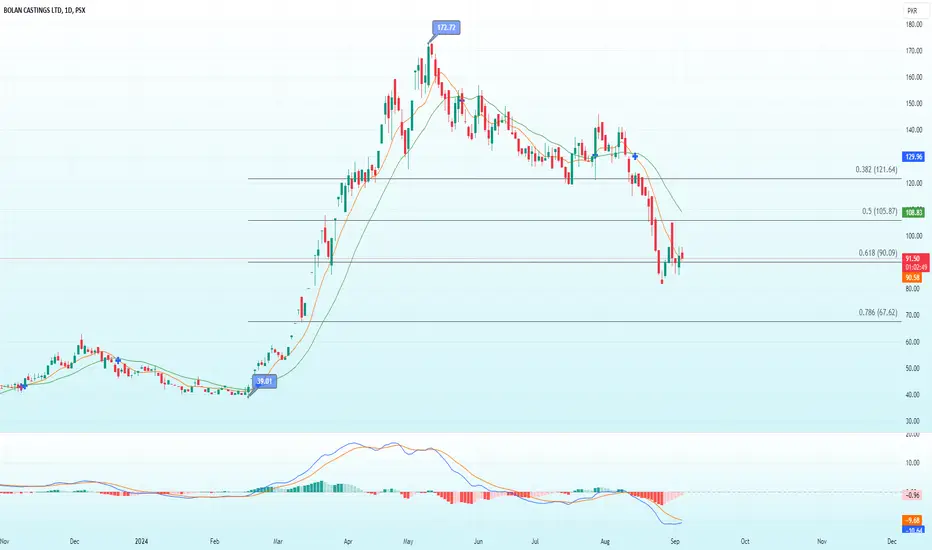
BCL is currently trading around its 200-day SMA and shows promising signs of a trend reversal. The MACD is below the zero line but nearing a bullish crossover, with the bearish histogram fading and potentially turning positive. Additionally, the stock is hovering above the 0.618 Fibonacci retracement level from Rs. 39.01 to Rs. 172.20, suggesting a potential recovery towards the 0.5 Fibonacci level at Rs. 105.87 and the 0.382 level at Rs. 121.64 (which aligns with the 50-day SMA). For a long position, consider entering as the recovery seems likely, with a stop loss set just below the previous low at Rs. 80.
註釋
Testing 0.618 Fib level, sustaining above shifts bullish reversal免責聲明
這些資訊和出版物並不意味著也不構成TradingView提供或認可的金融、投資、交易或其他類型的意見或建議。請在使用條款閱讀更多資訊。
免責聲明
這些資訊和出版物並不意味著也不構成TradingView提供或認可的金融、投資、交易或其他類型的意見或建議。請在使用條款閱讀更多資訊。