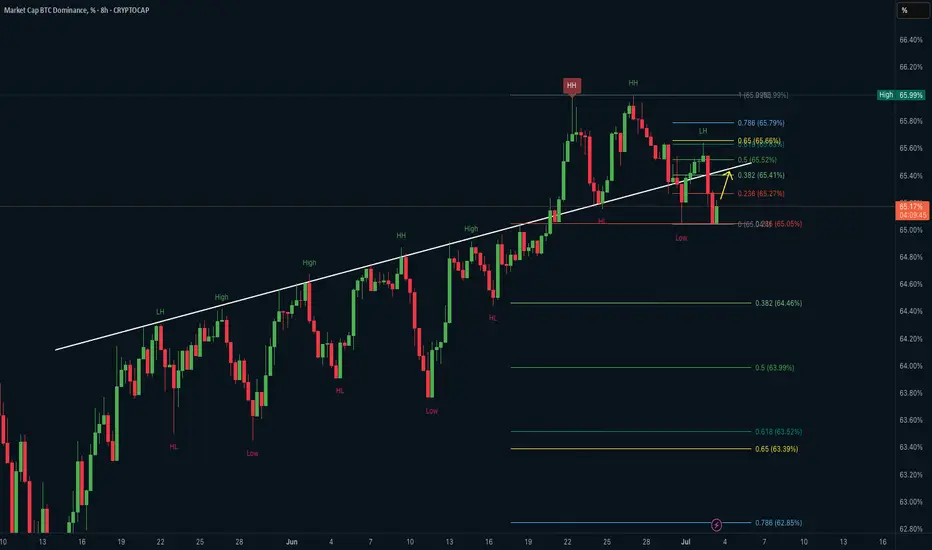
This analysis focuses on the 8 hour chart of Bitcoin Dominance (BTC.D), showing a possible retracement bounce after a recent market structure shift.
Key observations:
• BTC.D formed a higher high (HH) before pulling back sharply to a key demand zone.
• A long term ascending trendline has been broken and is currently being retested from below.
• Price tapped the 0.236 Fib retracement zone and is now bounce hard from that level.
• The yellow arrow suggests a possible short term move back toward the 0.382 or 0.5 Fib levels (~65.4%–65.5%).
Key levels to watch:
• Resistance: 65.52%, 65.66%, 65.79% (Fib cluster + previous LH)
• Support: 65.05% (local low), below which further downside may unfold
• A strong rejection at the 0.65 level could confirm lower high structure continuation
BTC Dominance is important for altcoin traders:
A rise in BTC dominance usually indicates capital rotating into BTC and away from alts, while a drop opens opportunities for altcoin strength.
免責聲明
這些資訊和出版物並不意味著也不構成TradingView提供或認可的金融、投資、交易或其他類型的意見或建議。請在使用條款閱讀更多資訊。