📊 Market Summary
– Bitcoin trades around $118,009, retreating from its intraday high of $118,330 .
– The recent rally was primarily fueled by $14.8 billion inflows into spot BTC ETFs, lifting BTC to an ATH of $123,000 on July 14
– Profit-taking has triggered a ~3% correction
– Market awaits key CPI/PPI inflation data and regulatory clarity in the US to guide next moves.
📉 Technical Analysis
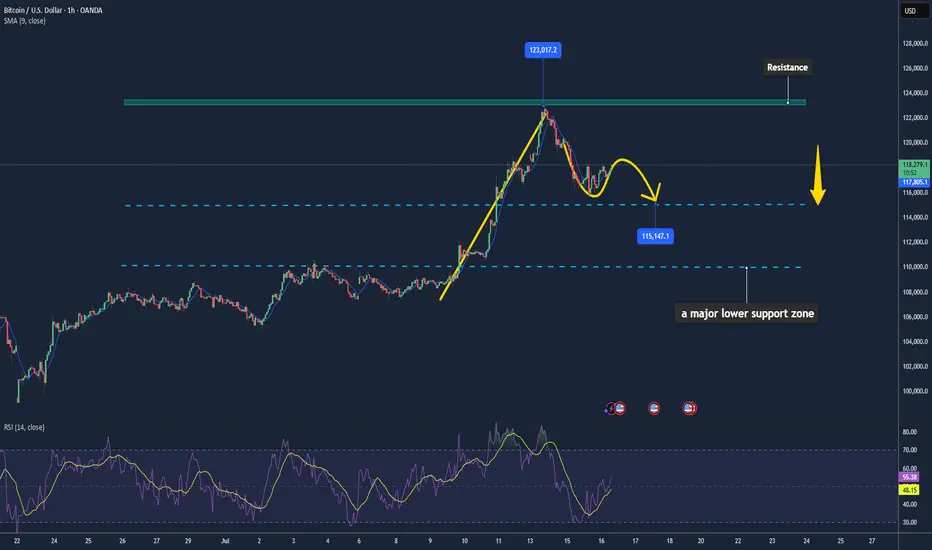
• Resistance: $123,000 – $123,100 (all-time high zone, weekly candle top).
• Support: $114,000 – $115,000 (potential retest zone, IH&S neckline, CME gap)
• EMA 9: Price remains above all major EMAs (10/20/50/100/200 day) – bullish short-term trend
• Candles / Volume / Momentum:
• Confirmed inverted head and shoulders breakout above ~$113,000 neckline
• RSI ~74 suggests overbought; short term pullback possible
• MACD bullish but on chain volumes are cooling, reflecting profit taking
📌 Outlook
– Expect a short-term cooldown/pullback toward $114,000–$115,000 for support testing.
– If support holds and ETF inflows continue, BTC could resume rally toward $130,000–$140,000
💡 Trade Strategy
🟣 SELL BTC/USD upon break below $117,000–$118,000 during retrace
🎯 TP: $115,000
❌ SL: $118,500
🟢 BUY BTC/USD at support $114,000–$115,000
🎯 TP: $120,000 – $123,000
❌ SL: $113,000
– Bitcoin trades around $118,009, retreating from its intraday high of $118,330 .
– The recent rally was primarily fueled by $14.8 billion inflows into spot BTC ETFs, lifting BTC to an ATH of $123,000 on July 14
– Profit-taking has triggered a ~3% correction
– Market awaits key CPI/PPI inflation data and regulatory clarity in the US to guide next moves.
📉 Technical Analysis
• Resistance: $123,000 – $123,100 (all-time high zone, weekly candle top).
• Support: $114,000 – $115,000 (potential retest zone, IH&S neckline, CME gap)
• EMA 9: Price remains above all major EMAs (10/20/50/100/200 day) – bullish short-term trend
• Candles / Volume / Momentum:
• Confirmed inverted head and shoulders breakout above ~$113,000 neckline
• RSI ~74 suggests overbought; short term pullback possible
• MACD bullish but on chain volumes are cooling, reflecting profit taking
📌 Outlook
– Expect a short-term cooldown/pullback toward $114,000–$115,000 for support testing.
– If support holds and ETF inflows continue, BTC could resume rally toward $130,000–$140,000
💡 Trade Strategy
🟣 SELL BTC/USD upon break below $117,000–$118,000 during retrace
🎯 TP: $115,000
❌ SL: $118,500
🟢 BUY BTC/USD at support $114,000–$115,000
🎯 TP: $120,000 – $123,000
❌ SL: $113,000
交易進行
Price remains steady near $119,000 with no clear breakout. Traders are watching for reactions around the key 120K level.📊 Forex | Gold | Crypto Market Insights & Signals
📰 Real-time news updates & expert analysis
📈 Daily Buy/Sell signals for investors
💡 Technical breakdowns & market outlooks
🔗 Join our free group: t.me/+DmS-dVFJMm40MDM9
📰 Real-time news updates & expert analysis
📈 Daily Buy/Sell signals for investors
💡 Technical breakdowns & market outlooks
🔗 Join our free group: t.me/+DmS-dVFJMm40MDM9
相關出版品
免責聲明
這些資訊和出版物並不意味著也不構成TradingView提供或認可的金融、投資、交易或其他類型的意見或建議。請在使用條款閱讀更多資訊。
📊 Forex | Gold | Crypto Market Insights & Signals
📰 Real-time news updates & expert analysis
📈 Daily Buy/Sell signals for investors
💡 Technical breakdowns & market outlooks
🔗 Join our free group: t.me/+DmS-dVFJMm40MDM9
📰 Real-time news updates & expert analysis
📈 Daily Buy/Sell signals for investors
💡 Technical breakdowns & market outlooks
🔗 Join our free group: t.me/+DmS-dVFJMm40MDM9
相關出版品
免責聲明
這些資訊和出版物並不意味著也不構成TradingView提供或認可的金融、投資、交易或其他類型的意見或建議。請在使用條款閱讀更多資訊。