📊 Bitcoin Daily – Probabilistic Swing in Play
Tracking the Snap Zone & Energy Reset
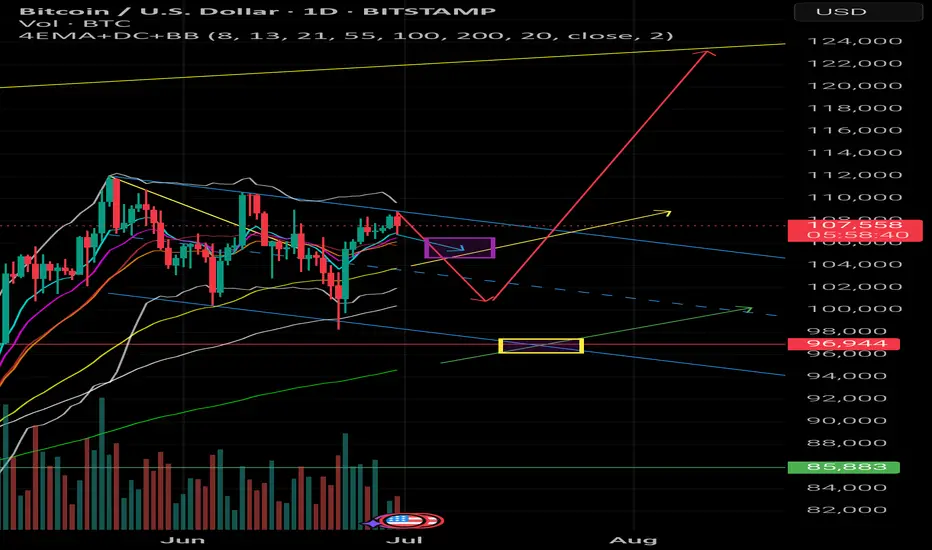
I’m watching a probabilistic swing scenario on Bitcoin where the price might need to dive into the 100k - 101k zone to build enough energy for the next major move.
The key area I’m tracking is the EMA 200 on the daily chart (~95k - 97k).
This would be the natural deep target if the price sweeps lower. The EMA 200 often acts as a long-term support where markets "reset" and gather strength.
👉 It’s also worth noting: Institutional traders traditionally view the daily EMA 200 as a key buy zone in an overall bullish market structure.
That’s where many large players reload positions, aiming to ride the next expansion wave.
What I’m expecting:
A retracement into 100k - 101k to snap the short EMAs together.
A potential liquidity sweep below the EMA 100, possibly down to the EMA 200 zone.
Key bullish signals: wick rejections, strong bounce candles, and engulfing patterns on the 4h or daily.
This would set up the energy for a clean bounce and a probable move towards the upper yellow trendline around 124k.
Without this deeper retracement, the move would likely run out of steam earlier, probably capping out around 112k.
I trade probabilistic scenarios based on natural price swings, EMA wave dynamics, and energy compression zones.
📌 Chart and path idea attached.
What’s your view? Are you watching this zone?
Tracking the Snap Zone & Energy Reset
I’m watching a probabilistic swing scenario on Bitcoin where the price might need to dive into the 100k - 101k zone to build enough energy for the next major move.
The key area I’m tracking is the EMA 200 on the daily chart (~95k - 97k).
This would be the natural deep target if the price sweeps lower. The EMA 200 often acts as a long-term support where markets "reset" and gather strength.
👉 It’s also worth noting: Institutional traders traditionally view the daily EMA 200 as a key buy zone in an overall bullish market structure.
That’s where many large players reload positions, aiming to ride the next expansion wave.
What I’m expecting:
A retracement into 100k - 101k to snap the short EMAs together.
A potential liquidity sweep below the EMA 100, possibly down to the EMA 200 zone.
Key bullish signals: wick rejections, strong bounce candles, and engulfing patterns on the 4h or daily.
This would set up the energy for a clean bounce and a probable move towards the upper yellow trendline around 124k.
Without this deeper retracement, the move would likely run out of steam earlier, probably capping out around 112k.
I trade probabilistic scenarios based on natural price swings, EMA wave dynamics, and energy compression zones.
📌 Chart and path idea attached.
What’s your view? Are you watching this zone?
免責聲明
這些資訊和出版物並不意味著也不構成TradingView提供或認可的金融、投資、交易或其他類型的意見或建議。請在使用條款閱讀更多資訊。
免責聲明
這些資訊和出版物並不意味著也不構成TradingView提供或認可的金融、投資、交易或其他類型的意見或建議。請在使用條款閱讀更多資訊。