Hit like & follow guys ;)
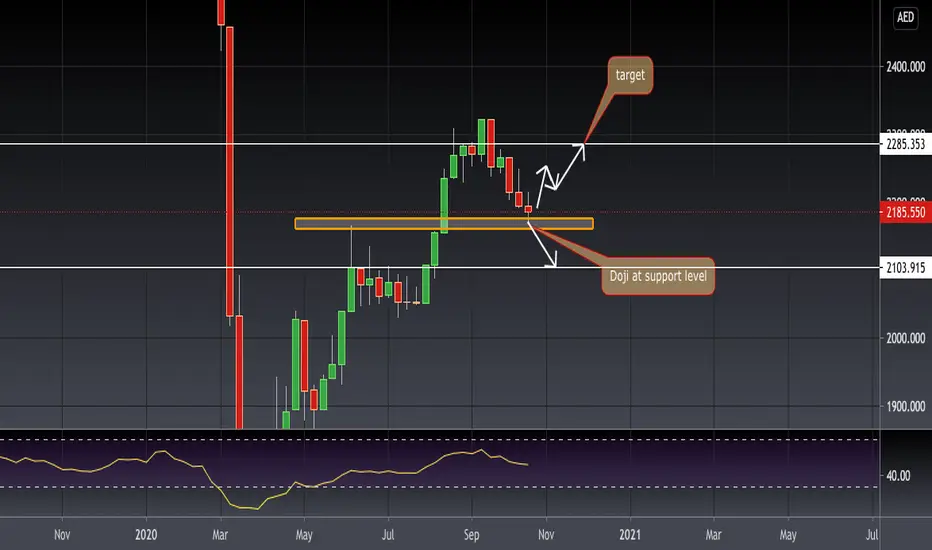
If we analyse weekly chart the uptrend is still intact and we are seeing a perfect doji candle at the support level. Good chances of market continuing its uptrend from this level. If 2185 holds up and if we can see a weekly candle close above 2220 it will be a good sign that market want to go higher. But at the same time if this level does not hold market can quickly slip to 2100 levels. Over all on a bigger time frame it looks bullish.
If we analyse weekly chart the uptrend is still intact and we are seeing a perfect doji candle at the support level. Good chances of market continuing its uptrend from this level. If 2185 holds up and if we can see a weekly candle close above 2220 it will be a good sign that market want to go higher. But at the same time if this level does not hold market can quickly slip to 2100 levels. Over all on a bigger time frame it looks bullish.
免責聲明
這些資訊和出版物並非旨在提供,也不構成TradingView提供或認可的任何形式的財務、投資、交易或其他類型的建議或推薦。請閱讀使用條款以了解更多資訊。
免責聲明
這些資訊和出版物並非旨在提供,也不構成TradingView提供或認可的任何形式的財務、投資、交易或其他類型的建議或推薦。請閱讀使用條款以了解更多資訊。