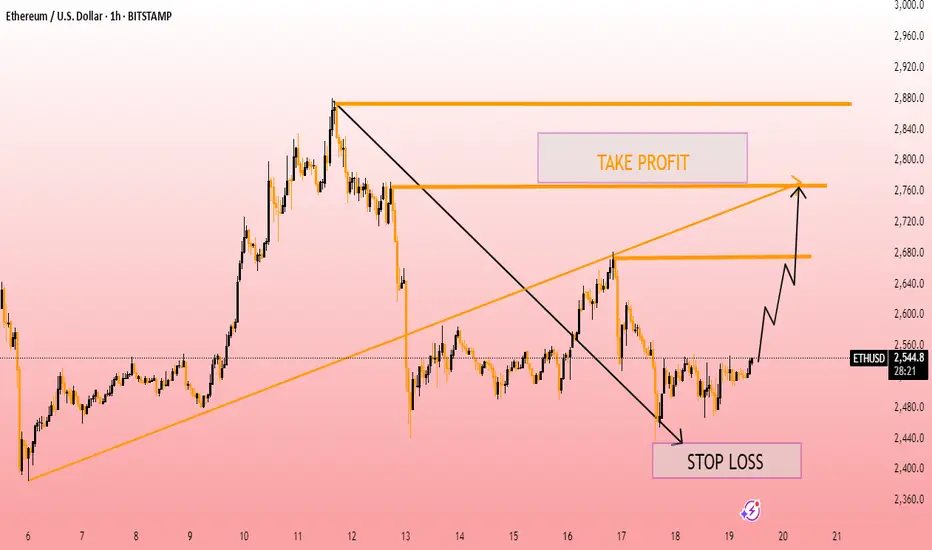
This ETH/USD (Ethereum to US Dollar) 1-hour chart outlines a bullish trade setup. Here's a breakdown of the analysis:
---
Chart Summary:
Current Price: ~$2,541.8
Bullish Projection: A move toward the $2,700–$2,800 range.
Take Profit Zone: Highlighted between $2,700 and $2,860, targeting a key resistance area.
Stop Loss: Marked below $2,440, just under recent support and the swing low.
Structure:
The price appears to have broken a descending trendline (black).
A potential higher low formation suggests bullish momentum.
Chart implies a possible breakout from a falling wedge pattern.
Mid-term target is a retest of a previous high around $2,860.
---
Trade Plan Based on the Chart:
Entry: Around the current price region ($2,540–$2,550), following the breakout.
Stop Loss: Below $2,440 to limit downside risk.
Take Profit: Targeting $2,700 initially, with a stretch goal near $2,860 if momentum continues.
---
Remarks:
Confirmation of bullish bias depends on breaking above $2,640–$2,680 resistance.
Volume confirmation and rejection of lower levels would further support the trade.
Consider potential volatility near resistance zones.
Would you like a detailed risk-to-reward ratio or a trading journal format for this setup?
---
Chart Summary:
Current Price: ~$2,541.8
Bullish Projection: A move toward the $2,700–$2,800 range.
Take Profit Zone: Highlighted between $2,700 and $2,860, targeting a key resistance area.
Stop Loss: Marked below $2,440, just under recent support and the swing low.
Structure:
The price appears to have broken a descending trendline (black).
A potential higher low formation suggests bullish momentum.
Chart implies a possible breakout from a falling wedge pattern.
Mid-term target is a retest of a previous high around $2,860.
---
Trade Plan Based on the Chart:
Entry: Around the current price region ($2,540–$2,550), following the breakout.
Stop Loss: Below $2,440 to limit downside risk.
Take Profit: Targeting $2,700 initially, with a stretch goal near $2,860 if momentum continues.
---
Remarks:
Confirmation of bullish bias depends on breaking above $2,640–$2,680 resistance.
Volume confirmation and rejection of lower levels would further support the trade.
Consider potential volatility near resistance zones.
Would you like a detailed risk-to-reward ratio or a trading journal format for this setup?
免責聲明
這些資訊和出版物並不意味著也不構成TradingView提供或認可的金融、投資、交易或其他類型的意見或建議。請在使用條款閱讀更多資訊。
免責聲明
這些資訊和出版物並不意味著也不構成TradingView提供或認可的金融、投資、交易或其他類型的意見或建議。請在使用條款閱讀更多資訊。