Key Observations:
✅ Current Price:
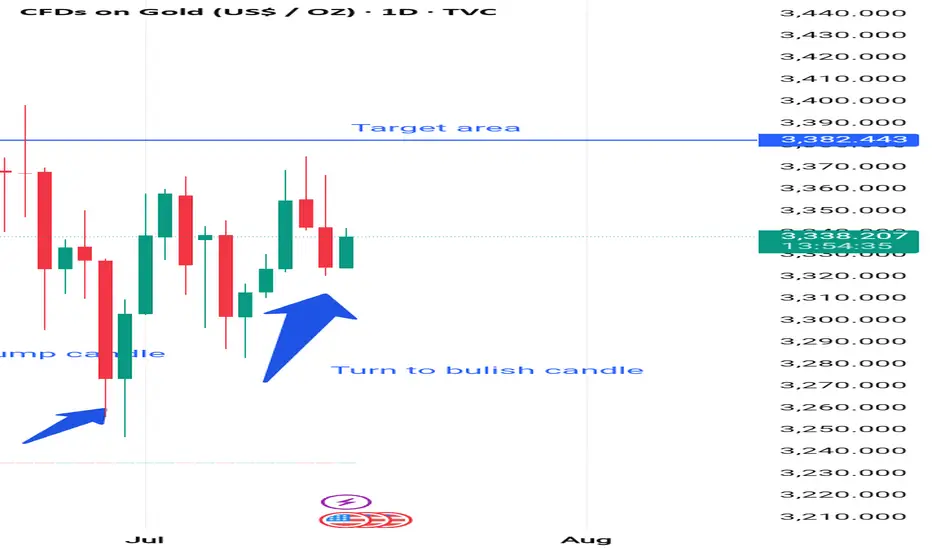
Gold is trading at $3,338.970, up $14.753 (+0.44%).
📈 Target Area:
A blue line is drawn at $3,382.443, indicating a target resistance area — likely where the trader expects the price to move.
📉 Recent Price Action:
The chart shows a series of red and green candles, indicating fluctuations with a recent bullish candle (green).
🔵 Annotated Points:
1. "Bullish pump candle" (end of June):
A strong bullish (green) candle pushing price upward.
2. "Turn to bullish candle" (early-mid July):
After a decline, the trend seems to shift back to bullish again.
📊 Technical Insight:
Higher lows are forming, indicating potential bullish momentum.
Price is moving upward again toward the target resistance area.
Previous attempts to break that $3,382 area have failed (note the wicks above the line), suggesting it's a strong resistance.
---
📌 Conclusion / Possible Strategy:
Bullish Bias: The chart implies a bullish trend is forming or resuming.
Target: $3,382.443 is the short-term target.
Confirmation Needed: A strong bullish candle closing above that resistance would confirm a breakout.
Risk Zone: If price reverses before hitting $3,382 or forms a bearish engulfing candle, a pullback may occur.
✅ Current Price:
Gold is trading at $3,338.970, up $14.753 (+0.44%).
📈 Target Area:
A blue line is drawn at $3,382.443, indicating a target resistance area — likely where the trader expects the price to move.
📉 Recent Price Action:
The chart shows a series of red and green candles, indicating fluctuations with a recent bullish candle (green).
🔵 Annotated Points:
1. "Bullish pump candle" (end of June):
A strong bullish (green) candle pushing price upward.
2. "Turn to bullish candle" (early-mid July):
After a decline, the trend seems to shift back to bullish again.
📊 Technical Insight:
Higher lows are forming, indicating potential bullish momentum.
Price is moving upward again toward the target resistance area.
Previous attempts to break that $3,382 area have failed (note the wicks above the line), suggesting it's a strong resistance.
---
📌 Conclusion / Possible Strategy:
Bullish Bias: The chart implies a bullish trend is forming or resuming.
Target: $3,382.443 is the short-term target.
Confirmation Needed: A strong bullish candle closing above that resistance would confirm a breakout.
Risk Zone: If price reverses before hitting $3,382 or forms a bearish engulfing candle, a pullback may occur.
免責聲明
這些資訊和出版物並不意味著也不構成TradingView提供或認可的金融、投資、交易或其他類型的意見或建議。請在使用條款閱讀更多資訊。
免責聲明
這些資訊和出版物並不意味著也不構成TradingView提供或認可的金融、投資、交易或其他類型的意見或建議。請在使用條款閱讀更多資訊。