As of June 6, 2025, HDFC Bank Ltd. (NSE: HDFCBANK) is trading at approximately ₹1,944.90. Here's a detailed technical analysis focusing on daily support and resistance levels:
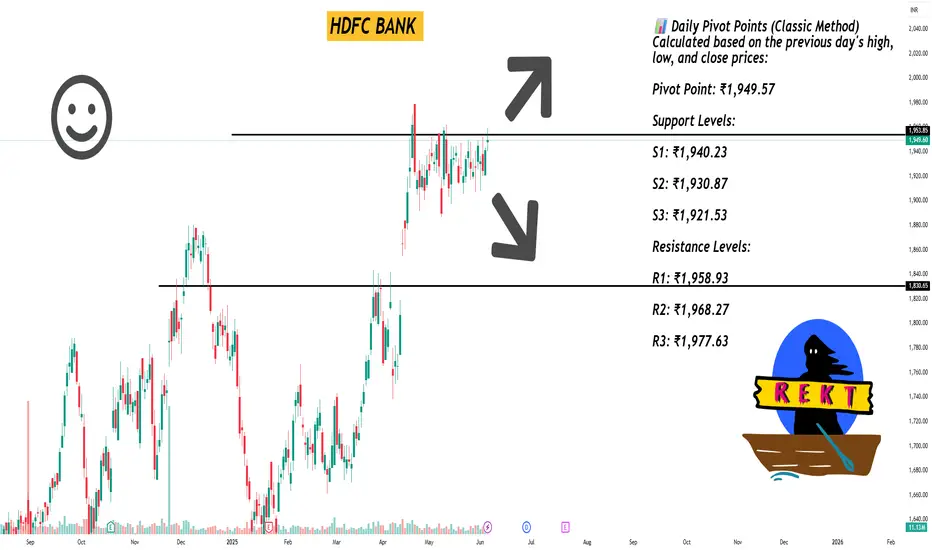
📊 Daily Pivot Points (Classic Method)
Calculated based on the previous day's high, low, and close prices:
Pivot Point: ₹1,949.57
Support Levels:
S1: ₹1,940.23
S2: ₹1,930.87
S3: ₹1,921.53
Resistance Levels:
R1: ₹1,958.93
R2: ₹1,968.27
R3: ₹1,977.63
Source: Top Stock Research
📈 Fibonacci Support & Resistance Levels
Based on Fibonacci calculations:
Support Levels:
S1: ₹1,942.42
S2: ₹1,938.01
S3: ₹1,930.87
Resistance Levels:
R1: ₹1,956.71
R2: ₹1,961.12
R3: ₹1,968.27
🔍 Camarilla Pivot Points
These levels are derived using the Camarilla method:
Support Levels:
S1: ₹1,947.89
S2: ₹1,946.17
S3: ₹1,944.46
Resistance Levels:
R1: ₹1,951.31
R2: ₹1,953.03
R3: ₹1,954.74
📌 Trading Insights
Immediate Support: ₹1,940.23 (Classic S1)
Immediate Resistance: ₹1,958.93 (Classic R1)
Traders may consider these levels for setting stop-loss and take-profit orders. A break above ₹1,958.93 could signal bullish momentum, while a drop below ₹1,940.23 might indicate bearish pressure.
Hello Guys ..
WhatsApp link- wa.link/d997q0
Email - techncialexpress@gmail.com ...
Script Coder/Trader//Investor from India. Drop a comment or DM if you have any questions! Let’s grow together!
WhatsApp link- wa.link/d997q0
Email - techncialexpress@gmail.com ...
Script Coder/Trader//Investor from India. Drop a comment or DM if you have any questions! Let’s grow together!
相關出版品
免責聲明
這些資訊和出版物並不意味著也不構成TradingView提供或認可的金融、投資、交易或其他類型的意見或建議。請在使用條款閱讀更多資訊。