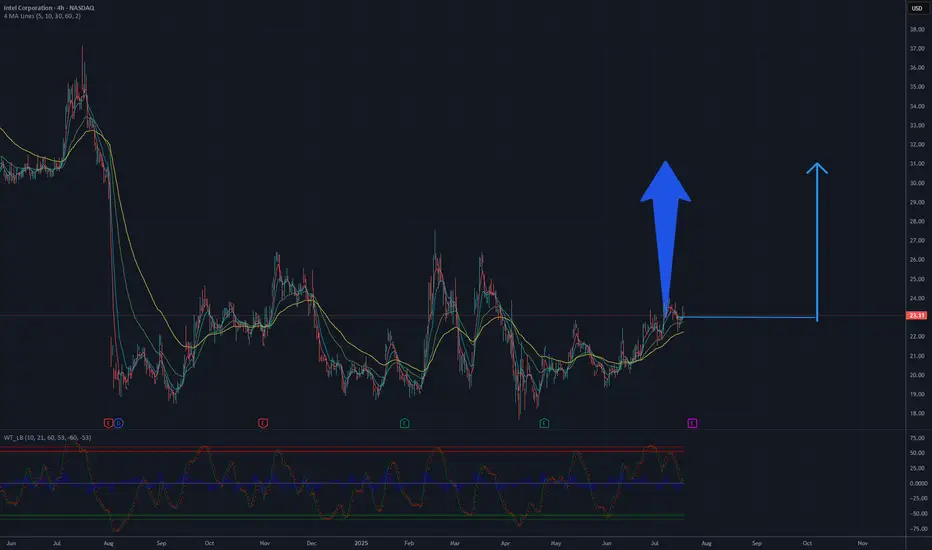
The Intel Corporation (INTC) chart on NASDAQ illustrates the stock price dynamics from 2024 to July 2025. Initially, the price rose to a peak in the first half of 2024, followed by a significant decline, reaching its lowest point around 24 USD by the end of 2024. Since then, the price has been consolidating in the 24-26 USD range, which may signal preparation for a potential rebound.
The moving averages (MA) on the chart suggest a gradual convergence of lines, indicating a possible turning point. Oscillators at the bottom of the chart, such as RSI, may indicate oversold conditions, supporting the hypothesis of an upward move. The 26 USD level acts as a strong support, and breaking above 28-30 USD could pave the way to 34 USD, a previous resistance level.
A potential rise to 34 USD is plausible if the price maintains momentum and breaks through the resistance with sufficient volume.
Potential TP: 32 USD
免責聲明
這些資訊和出版物並不意味著也不構成TradingView提供或認可的金融、投資、交易或其他類型的意見或建議。請在使用條款閱讀更多資訊。
免責聲明
這些資訊和出版物並不意味著也不構成TradingView提供或認可的金融、投資、交易或其他類型的意見或建議。請在使用條款閱讀更多資訊。