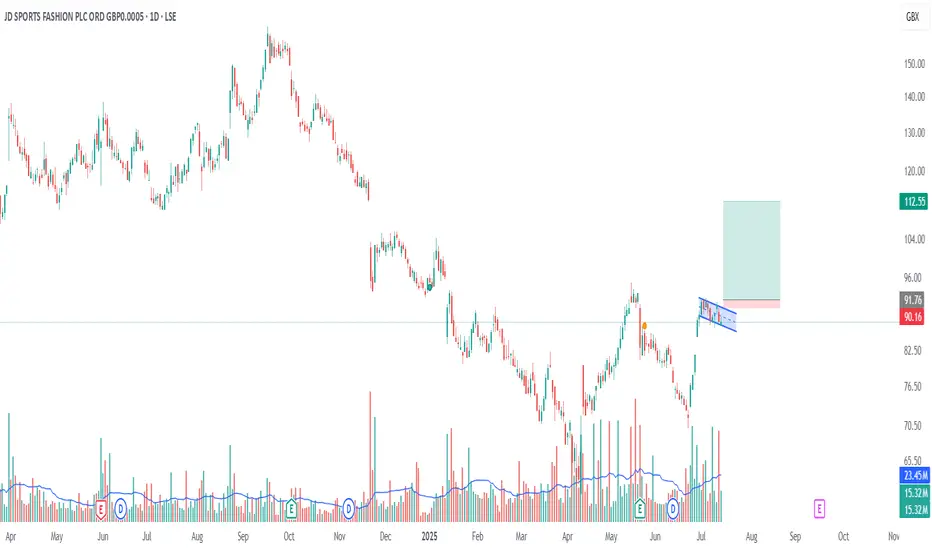
A bull flag pattern is forming on the 1-day chart, supported by a steady increase in volume—suggesting growing bullish momentum.
Flagpole base: ~72
Potential breakout level: ~92
First price target (PT1): ~100 (next key resistance level)
Measured move target (PT2): ~112 (based on flagpole height)
This setup indicates a strong potential for continuation if price breaks above the 92 level with volume confirmation.
Flagpole base: ~72
Potential breakout level: ~92
First price target (PT1): ~100 (next key resistance level)
Measured move target (PT2): ~112 (based on flagpole height)
This setup indicates a strong potential for continuation if price breaks above the 92 level with volume confirmation.
免責聲明
這些資訊和出版物並不意味著也不構成TradingView提供或認可的金融、投資、交易或其他類型的意見或建議。請在使用條款閱讀更多資訊。
免責聲明
這些資訊和出版物並不意味著也不構成TradingView提供或認可的金融、投資、交易或其他類型的意見或建議。請在使用條款閱讀更多資訊。