Al Mazaya has entered a confirmed bearish phase, supported by multiple technical signals. The current setup suggests a continuation of the downside movement, with two key downside targets in play.
Key Technical Signals:
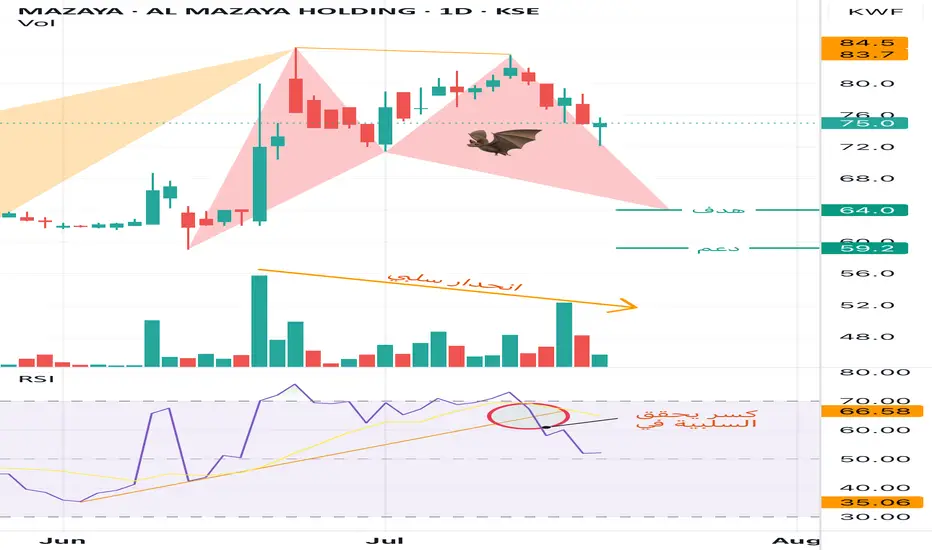
1. Bearish Harmonic Pattern – Bat Formation:
• The chart has formed a harmonic Bat pattern, which typically precedes a price decline.
• The pattern’s projected target is 64.0 KWF, with a further potential move toward 59.2 KWF, acting as a second-line support if the initial support near 63.0 KWF fails.
2. RSI Breakdown:
• The Relative Strength Index (RSI) has broken below its rising trendline and the moving average, confirming loss of momentum.
• This breakdown is a strong bearish signal, indicating weakening demand and increasing selling pressure.
3. Volume Decline – Negative Divergence:
• A clear volume divergence is visible, with trading volumes declining despite previous price rallies.
• This indicates distribution behavior, where smart money may be exiting positions, adding to the bearish bias.
Support and Resistance Levels:
• Current Price: 75.0 KWF
• First Support / Bat Target: 64.0 KWF
• Second Support: 59.2 KWF
• Resistance Range: 83.7 – 84.5 KWF (previous swing high)
Conclusion:
The technical structure for Al Mazaya Holding has shifted to bearish. The breakdown in RSI, the completion of the Bearish Bat pattern, and the diminishing volume all reinforce the possibility of a price decline toward 64.0 KWF, and potentially to 59.2 KWF if downward momentum continues. Investors should exercise caution and closely monitor support levels for any reversal signs.
Key Technical Signals:
1. Bearish Harmonic Pattern – Bat Formation:
• The chart has formed a harmonic Bat pattern, which typically precedes a price decline.
• The pattern’s projected target is 64.0 KWF, with a further potential move toward 59.2 KWF, acting as a second-line support if the initial support near 63.0 KWF fails.
2. RSI Breakdown:
• The Relative Strength Index (RSI) has broken below its rising trendline and the moving average, confirming loss of momentum.
• This breakdown is a strong bearish signal, indicating weakening demand and increasing selling pressure.
3. Volume Decline – Negative Divergence:
• A clear volume divergence is visible, with trading volumes declining despite previous price rallies.
• This indicates distribution behavior, where smart money may be exiting positions, adding to the bearish bias.
Support and Resistance Levels:
• Current Price: 75.0 KWF
• First Support / Bat Target: 64.0 KWF
• Second Support: 59.2 KWF
• Resistance Range: 83.7 – 84.5 KWF (previous swing high)
Conclusion:
The technical structure for Al Mazaya Holding has shifted to bearish. The breakdown in RSI, the completion of the Bearish Bat pattern, and the diminishing volume all reinforce the possibility of a price decline toward 64.0 KWF, and potentially to 59.2 KWF if downward momentum continues. Investors should exercise caution and closely monitor support levels for any reversal signs.
免責聲明
這些資訊和出版物並不意味著也不構成TradingView提供或認可的金融、投資、交易或其他類型的意見或建議。請在使用條款閱讀更多資訊。