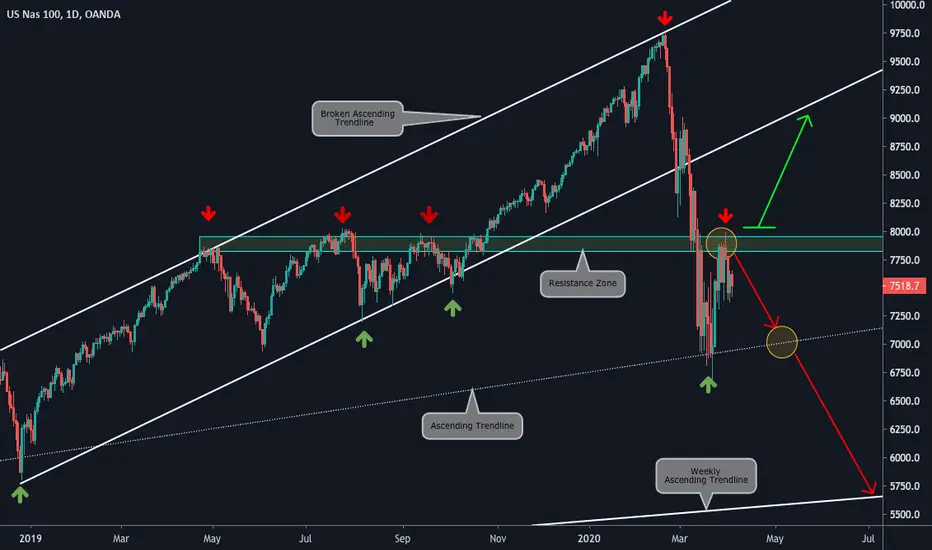
Daily Chart Explanation:
- Price broke the Ascending Channel and, then, went towards the Ascending Trendline.
- It bounced from there until it faced the Resistance Zone.
- After that, it started the down move again.
- We will be looking for sell setups until price breaks the Resistance Zone at 8.000.
4H Vision:

Weekly Vision:

Updates coming soon!
- Price broke the Ascending Channel and, then, went towards the Ascending Trendline.
- It bounced from there until it faced the Resistance Zone.
- After that, it started the down move again.
- We will be looking for sell setups until price breaks the Resistance Zone at 8.000.
4H Vision:
Weekly Vision:
Updates coming soon!
免責聲明
這些資訊和出版物並不意味著也不構成TradingView提供或認可的金融、投資、交易或其他類型的意見或建議。請在使用條款閱讀更多資訊。
免責聲明
這些資訊和出版物並不意味著也不構成TradingView提供或認可的金融、投資、交易或其他類型的意見或建議。請在使用條款閱讀更多資訊。