Shortly after publishing its financial results, Netflix posted a decline of over 5% toward the end of the week and continues to show a strong bearish bias. This comes despite reporting a positive earnings per share (EPS) figure of $7.19, beating the expected $7.08, and revenue of $11.08 billion, slightly above the forecast of $11.07 billion.
However, in its post-earnings communications, the company stated that it expects very moderate growth for the remainder of the year. It also warned that the positive indicators could begin to compress due to increased spending on marketing and content, which has ultimately weakened the impact of the solid financial results. As a result, the stock faced persistent selling pressure heading into the weekly close.
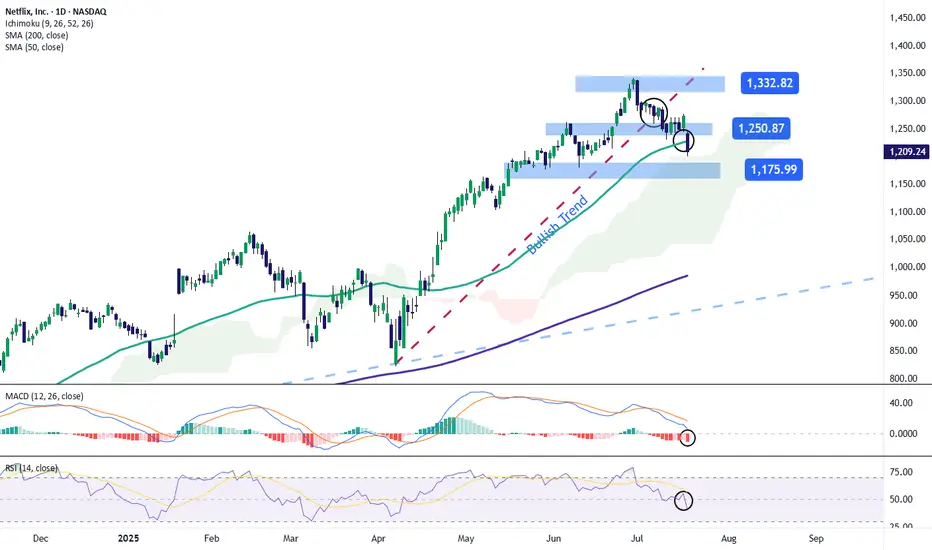
Uptrend Breaks
Over the past few weeks, starting in early April, the stock had followed a steady uptrend, pushing the price above $1,300. However, continued bearish corrections have now brought the price down to the $1,200 area, causing a clear break in the previous uptrend. This breakdown could further strengthen the bearish pressure in the coming sessions if the negative sentiment persists.
MACD
The MACD histogram continues to move below the zero line, and as it drifts further from this level, it signals a steady bearish momentum that could remain dominant in the near term if the trend continues.
RSI
The RSI line has broken sharply below the neutral 50 level, indicating a clear dominance of bearish momentum in the market. As long as it does not reach oversold territory, this move may suggest a continued increase in short-term selling pressure.
Key Levels:
Written by Julian Pineda, CFA – Market Analyst
However, in its post-earnings communications, the company stated that it expects very moderate growth for the remainder of the year. It also warned that the positive indicators could begin to compress due to increased spending on marketing and content, which has ultimately weakened the impact of the solid financial results. As a result, the stock faced persistent selling pressure heading into the weekly close.
Uptrend Breaks
Over the past few weeks, starting in early April, the stock had followed a steady uptrend, pushing the price above $1,300. However, continued bearish corrections have now brought the price down to the $1,200 area, causing a clear break in the previous uptrend. This breakdown could further strengthen the bearish pressure in the coming sessions if the negative sentiment persists.
MACD
The MACD histogram continues to move below the zero line, and as it drifts further from this level, it signals a steady bearish momentum that could remain dominant in the near term if the trend continues.
RSI
The RSI line has broken sharply below the neutral 50 level, indicating a clear dominance of bearish momentum in the market. As long as it does not reach oversold territory, this move may suggest a continued increase in short-term selling pressure.
Key Levels:
- 1,332 – Recent High: This is the most important resistance level. If price action returns to this area, it could reactivate the previous uptrend, which had been weakening on the chart.
- 1,250 – Nearby Resistance: A barrier defined by the most recent neutral zone. It may act as a temporary ceiling against short-term bullish corrections.
- 1,175 – Key Support: A critical level located below the 50-period simple moving average. If the price breaks below this level, it could strengthen a bearish bias and trigger a more consistent downtrend.
Written by Julian Pineda, CFA – Market Analyst
免責聲明
這些資訊和出版物並不意味著也不構成TradingView提供或認可的金融、投資、交易或其他類型的意見或建議。請在使用條款閱讀更多資訊。