📈 Chart Structure Overview
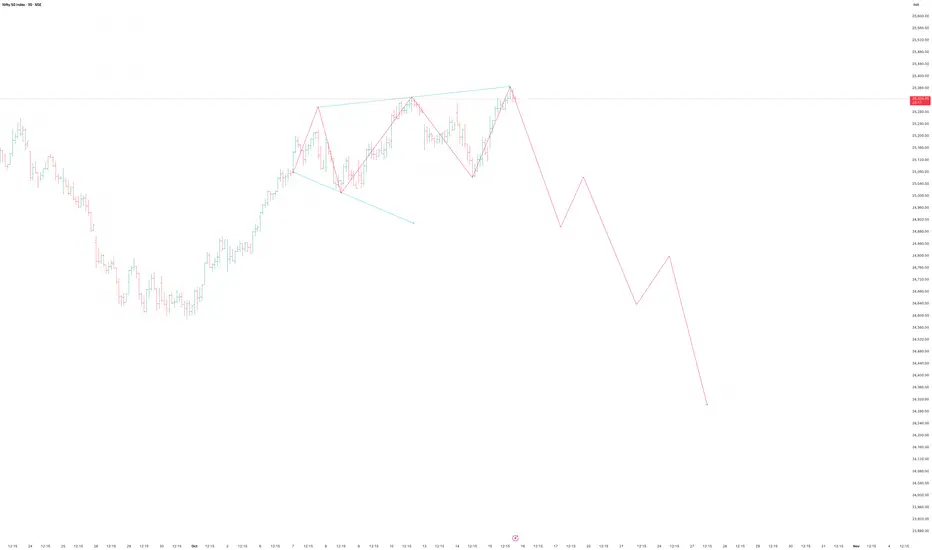
The chart clearly shows a rising wedge formation — a bearish reversal pattern typically appearing at the end of a bullish rally.
✅ Summary View
Aspect Observation
Pattern Rising Wedge (Bearish)
Bias Short-term corrective / bearish
Key Resistance 25,380–25,420
Key Breakdown Zone 25,120
Targets 24,900 → 24,700 → 24,400
Stop-loss (for short) 25,450
Conclusion
Nifty’s price action suggests distribution and exhaustion at the top.
A confirmed breakdown below 25,120 could open up a short-term correction of 500–700 points.
Stay cautious of false breakouts above 25,400 unless backed by strong volume.
Disclaimer:
This analysis is for educational and technical insight purposes only.
Trading decisions should be based on your own confirmation strategy, volume validation, and risk management.
交易進行
註釋
Fall from here is impulsive. 免責聲明
這些資訊和出版物並不意味著也不構成TradingView提供或認可的金融、投資、交易或其他類型的意見或建議。請在使用條款閱讀更多資訊。
免責聲明
這些資訊和出版物並不意味著也不構成TradingView提供或認可的金融、投資、交易或其他類型的意見或建議。請在使用條款閱讀更多資訊。