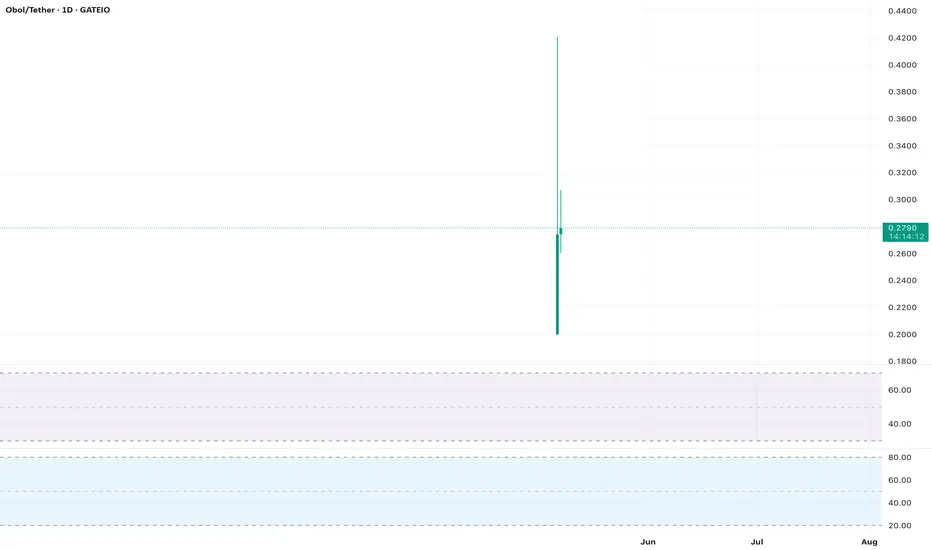
Analysis: $OBOL has broken below the critical support at $0.29161 with high selling volume (>150M), as highlighted in recent X posts. This confirms a markdown phase with lower lows and bearish candlestick patterns on the 4-hour chart. The Moving Average Convergence Divergence (MACD) shows a bearish crossover, and the price is trading below the 20-day EMA, reinforcing downside pressure. A retest of $0.25 is likely if selling continues. Entry: $0.29 (on pullback to $0.295). Stop Loss: $0.305. Take Profit: $0.25, $0.235.
免責聲明
這些資訊和出版物並不意味著也不構成TradingView提供或認可的金融、投資、交易或其他類型的意見或建議。請在使用條款閱讀更多資訊。
免責聲明
這些資訊和出版物並不意味著也不構成TradingView提供或認可的金融、投資、交易或其他類型的意見或建議。請在使用條款閱讀更多資訊。
