PNUT/USDT – Breakout Watch from Symmetrical Triangle
Chart pattern: Symmetrical Triangle
Timeframe: 4-Hour
Published: June 20, 2025
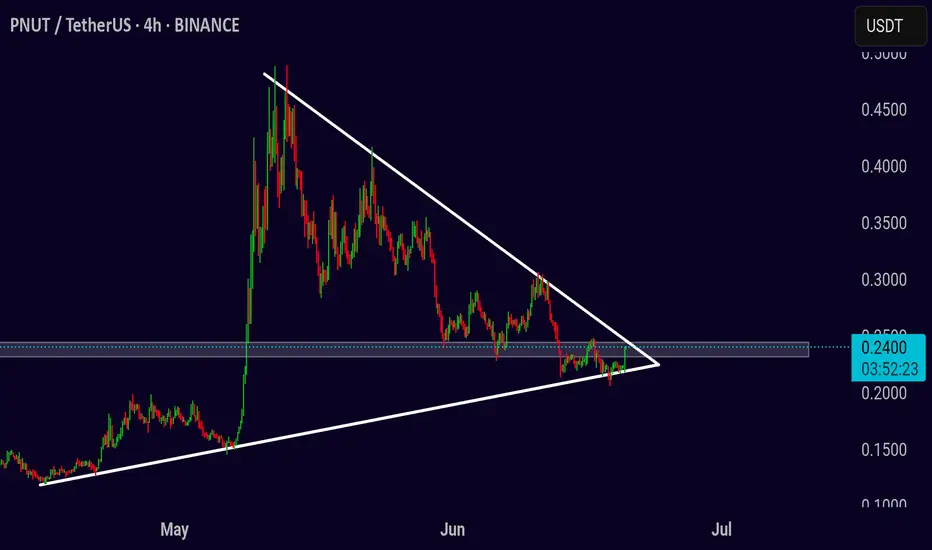
PNUT/USDT is nearing the apex of a symmetrical triangle that has been forming over several weeks. The price is tightening between rising support and descending resistance, indicating a breakout is likely approaching soon.
Price is currently testing the upper boundary near 0.24. A breakout from this level with strong volume may trigger a bullish move, while rejection could keep price inside the range a little longer.
Bullish scenario
Entry: 4H close above 0.245 with volume
Target 1: 0.28
Target 2: 0.33
Stop-loss: Below 0.22
Bearish scenario
Entry: Break below 0.215
Target 1: 0.18
Target 2: 0.14
Stop-loss: Above 0.24
Wait for confirmation before acting — momentum will likely follow once the triangle breaks.
Chart pattern: Symmetrical Triangle
Timeframe: 4-Hour
Published: June 20, 2025
PNUT/USDT is nearing the apex of a symmetrical triangle that has been forming over several weeks. The price is tightening between rising support and descending resistance, indicating a breakout is likely approaching soon.
Price is currently testing the upper boundary near 0.24. A breakout from this level with strong volume may trigger a bullish move, while rejection could keep price inside the range a little longer.
Bullish scenario
Entry: 4H close above 0.245 with volume
Target 1: 0.28
Target 2: 0.33
Stop-loss: Below 0.22
Bearish scenario
Entry: Break below 0.215
Target 1: 0.18
Target 2: 0.14
Stop-loss: Above 0.24
Wait for confirmation before acting — momentum will likely follow once the triangle breaks.
🚀 Join My Telegram Community for FREE trading signals, entry/exit points, and instant updates!
👉 t.me/cryptobyghazii
👉 t.me/cryptobyghazii
免責聲明
這些資訊和出版物並不意味著也不構成TradingView提供或認可的金融、投資、交易或其他類型的意見或建議。請在使用條款閱讀更多資訊。
🚀 Join My Telegram Community for FREE trading signals, entry/exit points, and instant updates!
👉 t.me/cryptobyghazii
👉 t.me/cryptobyghazii
免責聲明
這些資訊和出版物並不意味著也不構成TradingView提供或認可的金融、投資、交易或其他類型的意見或建議。請在使用條款閱讀更多資訊。