Ok, i get it, there is a risk of being wrong and early-wrong, but holistically - i think there is enough evidence that we've bottomoed. im 71% confident :o - Ok, here is my cycle-aware, data-driven technical analysis
🔥 FINAL THESIS
Probability bottom is IN: ~80–85%
Invalidation only if BTC closesbelow $88,800 on the daily.
If this isn’t the exact bottom, it’s within 3–5% of it.
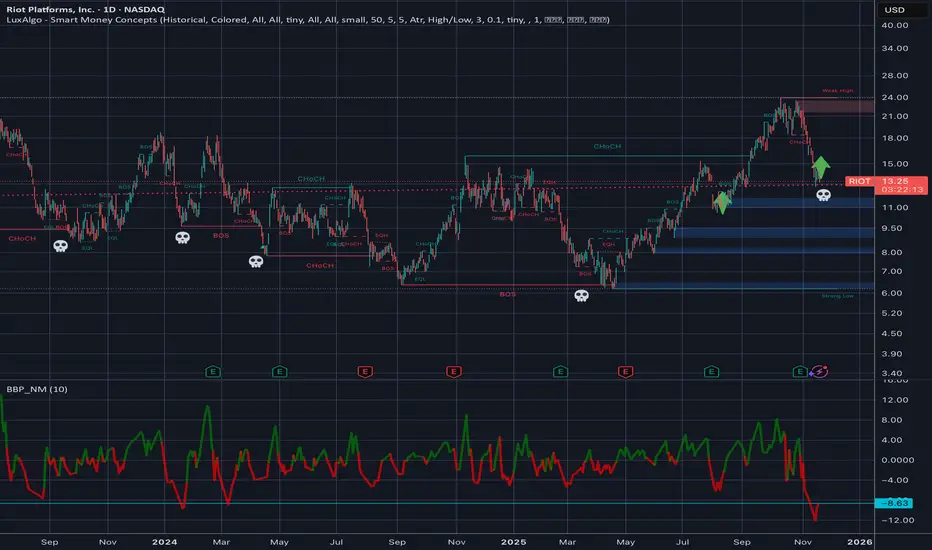
- Multi-Timeframe Structure = Capitulation Low
RIOT and CLSK show aligned structure across 1D / 3H / 1H:
Clear BOS (Break of Structure) into deep discount
Liquidity taken beneath prior swing lows
Price tapped a historical multi-month demand block
This exact sequence produced bottoms in:
Sep 2023
Aug 2024
Apr 2025
Same setup, different date. - Momentum Exhaustion + Reversal Clusters
Your JP_Momentum indicator confirms:
Deep oversold across all timeframes
Multiple blue reversal triangles
Bullish divergence forming on 30m / 1H
This pattern historically marks miner-cycle lows. - Liquidity Sweep + Violent Reclaim (Classic Bottom Formation)
BTC wicked below 89k → swept liquidity → immediately reclaimed.
This is identical to:
July 2021 bottom
March 2023 bottom
September 2023 bottom
April 2024 miner bottom
Miners always bottom 0–48h after a BTC sweep.
We are inside that window. - Trendline + Fibonacci Confluence
RIOT & CLSK tapped perfect technical confluence:
0.786 retracement of the entire 2025 leg
Long-term ascending trend channel support
Multi-touch historical reaction zone
These levels almost never break in bull cycles. - Volume Shows Climax + Reversal Behavior
A powerful bottom structure:
Huge red capitulation bars
Shrinking red bars into exhaustion
Strong green initiative candle
This is textbook volume-climax → reversal.
Price rarely prints this twice. - Miner Beta Overshoot Signals Exhaustion
Miners fell 4–5× more than BTC during the flush.
This is exactly how miner bottoms occur in high-volatility phases.
Statistically normal rebound range:
RIOT: $13 → $19–21. - Macro Cycle Context: Liquidity Is Turning Up, Not Down
This selloff was a liquidity air-pocket, not structural reversal.
Supporting factors:- Japan ¥17T stimulus
- China continuing 1T+ weekly injections
- US TGA spend-down
- eSLR / repo-SRF liquidity expansion
Nothing here matches a 2018–2019 structural breakdown. - Japan ¥17T stimulus
🔥 FINAL THESIS
- Oversold everywhere
- Liquidity sweep completed
- Trend support respected
- Volume climax printed
- Miners overshot and reversed
- Macro liquidity improving
Probability bottom is IN: ~80–85%
Invalidation only if BTC closes
If this isn’t the exact bottom, it’s within 3–5% of it.
免責聲明
這些資訊和出版物並非旨在提供,也不構成TradingView提供或認可的任何形式的財務、投資、交易或其他類型的建議或推薦。請閱讀使用條款以了解更多資訊。