🟩
SKYGOLD (15M) | NSE | Heikin Ashi
🟢 LONG BIAS
📅 Updated: July 17
---
🔍 Description
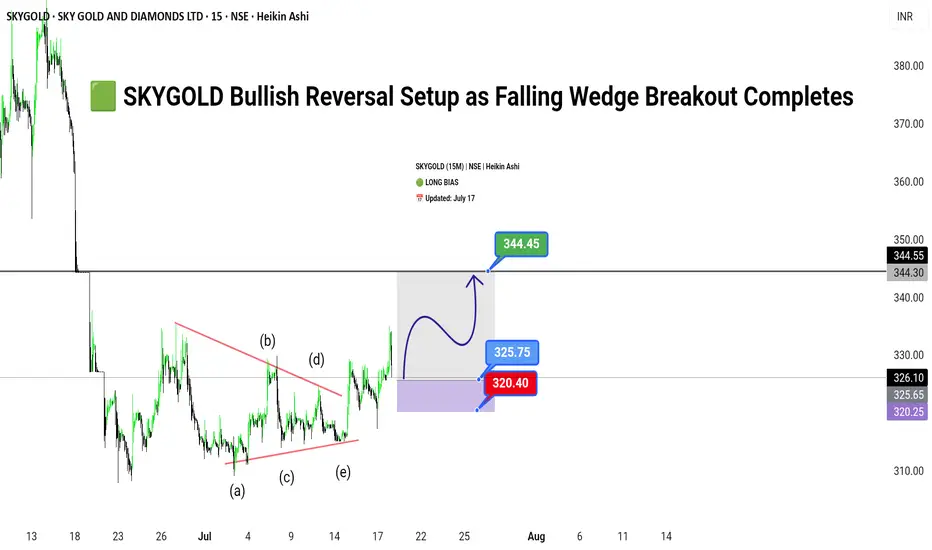
SKYGOLD has emerged from a prolonged corrective phase, breaking out of a well-defined falling wedge pattern on the 15-minute chart. The price action has respected a clean Elliott Wave ABCDE structure within the wedge, suggesting a completed consolidation cycle. With bullish momentum building above ₹325, the stock now appears poised for a breakout rally towards ₹344.45.
This setup reflects both a technical breakout and possible short-covering rally, making it an attractive opportunity for short-term swing traders. However, risk remains below the ₹320.40 zone, which invalidates the breakout structure if breached.
---
📊 Technical Structure (15M)
✅ Breakout above wedge resistance
✅ ABCDE wave structure complete (classic consolidation)
✅ Impulse targets in sight
📌 Upside Targets
First: ₹325.75
Final: ₹344.45
🔻 Risk Zone
Below: ₹320.40 (Breakdown invalidates setup)
---
📈 Fundamental/Flow Highlights
Sector Sentiment: Positive traction in mid-cap jewellery and gems segment.
Volume Spike: Notable rise in volume on breakout candle.
Short-Covering Potential: Highly likely due to prolonged consolidation.
---
⚠️ Risks to Watch
Sudden broad market correction in Nifty Midcap segment.
Lack of follow-through volume post-breakout.
Intraday rejection near ₹344 zone (previous supply).
---
🧭 Summary: Bias and Watchpoints
SKYGOLD is bullish above ₹325 with a breakout structure favoring continued upside toward ₹344.45. As long as the price holds above ₹320.40, the long thesis remains valid. Watch volume confirmation, and use trailing SL to lock gains.
SKYGOLD (15M) | NSE | Heikin Ashi
🟢 LONG BIAS
📅 Updated: July 17
---
🔍 Description
SKYGOLD has emerged from a prolonged corrective phase, breaking out of a well-defined falling wedge pattern on the 15-minute chart. The price action has respected a clean Elliott Wave ABCDE structure within the wedge, suggesting a completed consolidation cycle. With bullish momentum building above ₹325, the stock now appears poised for a breakout rally towards ₹344.45.
This setup reflects both a technical breakout and possible short-covering rally, making it an attractive opportunity for short-term swing traders. However, risk remains below the ₹320.40 zone, which invalidates the breakout structure if breached.
---
📊 Technical Structure (15M)
✅ Breakout above wedge resistance
✅ ABCDE wave structure complete (classic consolidation)
✅ Impulse targets in sight
📌 Upside Targets
First: ₹325.75
Final: ₹344.45
🔻 Risk Zone
Below: ₹320.40 (Breakdown invalidates setup)
---
📈 Fundamental/Flow Highlights
Sector Sentiment: Positive traction in mid-cap jewellery and gems segment.
Volume Spike: Notable rise in volume on breakout candle.
Short-Covering Potential: Highly likely due to prolonged consolidation.
---
⚠️ Risks to Watch
Sudden broad market correction in Nifty Midcap segment.
Lack of follow-through volume post-breakout.
Intraday rejection near ₹344 zone (previous supply).
---
🧭 Summary: Bias and Watchpoints
SKYGOLD is bullish above ₹325 with a breakout structure favoring continued upside toward ₹344.45. As long as the price holds above ₹320.40, the long thesis remains valid. Watch volume confirmation, and use trailing SL to lock gains.
免責聲明
這些資訊和出版物並不意味著也不構成TradingView提供或認可的金融、投資、交易或其他類型的意見或建議。請在使用條款閱讀更多資訊。
免責聲明
這些資訊和出版物並不意味著也不構成TradingView提供或認可的金融、投資、交易或其他類型的意見或建議。請在使用條款閱讀更多資訊。