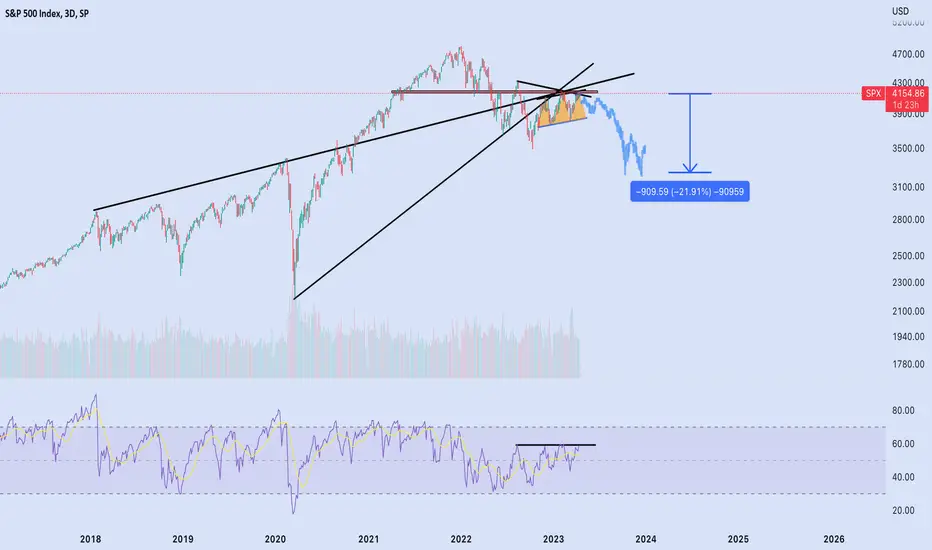
As you can see  SPX is running to major resistance levels and trend lines.
Appears to be forming a right shoulder of bearish Head and Shoulders chart pattern.
 NFLX is expected to mis earnings and is already dumping after hours market.
Could bad earnings of other big companies going to be the catalyst for the next wave down?
Many bears are predicting a 20% drop if thats the case.
You can also see a triple bearish divergence on RSI.
🐻🎣
Appears to be forming a right shoulder of bearish Head and Shoulders chart pattern.
Could bad earnings of other big companies going to be the catalyst for the next wave down?
Many bears are predicting a 20% drop if thats the case.
You can also see a triple bearish divergence on RSI.
🐻🎣
免責聲明
這些資訊和出版物並不意味著也不構成TradingView提供或認可的金融、投資、交易或其他類型的意見或建議。請在使用條款閱讀更多資訊。
免責聲明
這些資訊和出版物並不意味著也不構成TradingView提供或認可的金融、投資、交易或其他類型的意見或建議。請在使用條款閱讀更多資訊。