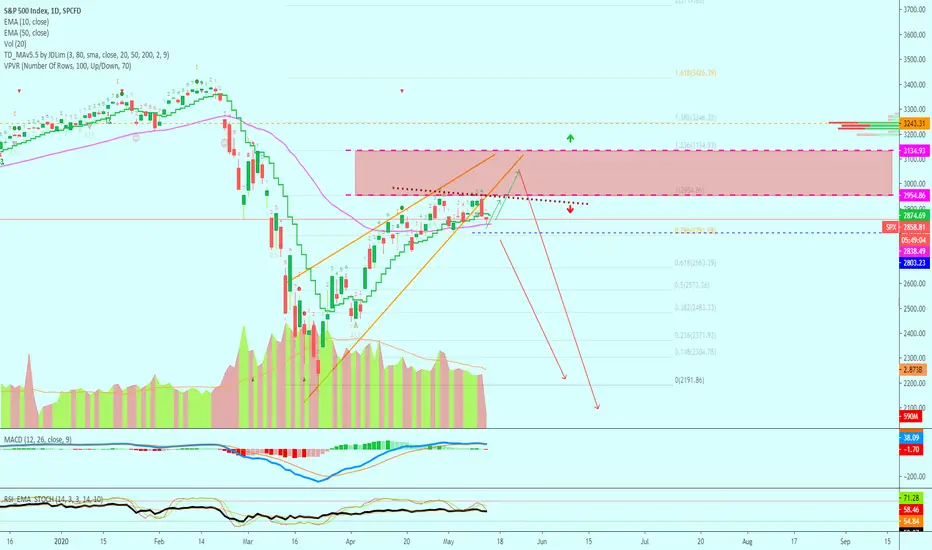
The falling wedge we saw recently on the SPX (S&P 500 Index) has been broken... Below the SPX chart signals
- We now have prices trading below EMA10 and bouncing of EMA50.
- The MACD is showing a bearish cross while it starts to trend down.
- The trading volume continues to go lower, which is a bearish signal.
- We also have a lower high yesterday compared to the 29th of April.
These are the signals coming from this chart, which are mostly bearish.
If EMA50 holds (2838.53), prices can bounce, but when this level breaks it can go straight down.
Here is my previous analysis...
You can hit LIKE to help us grow... To show your support.
Thanks again.
Namaste.
Namaste.
🚨 TOP FREE Trades
»ETH +1340%
»AAVE +1134%
»XRP +749%
»DOGS +868%
»BTC +563% 👇
t.me/anandatrades/1350
🚨 FREE Quality Content + 🏆New Results
t.me/masteranandatrades/6499
🚨 PREMIUM LIFETIME
lamatrades.com (Since 2017)
»ETH +1340%
»AAVE +1134%
»XRP +749%
»DOGS +868%
»BTC +563% 👇
t.me/anandatrades/1350
🚨 FREE Quality Content + 🏆New Results
t.me/masteranandatrades/6499
🚨 PREMIUM LIFETIME
lamatrades.com (Since 2017)
免責聲明
這些資訊和出版物並不意味著也不構成TradingView提供或認可的金融、投資、交易或其他類型的意見或建議。請在使用條款閱讀更多資訊。