SPY July 8th 2025
Day 2 of journaling my trades. Ended Monday green but not without mistakes. I am heading into Tuesday with more of a neutral outlook. Previous resistance will be tested as support and could find buyers or fail to do so. As I did yesterday, I will give a breakdown of what I’m seeing on all of my charts for both strategies.
+++++++++++++++++++++++++++
Bullish Analysis

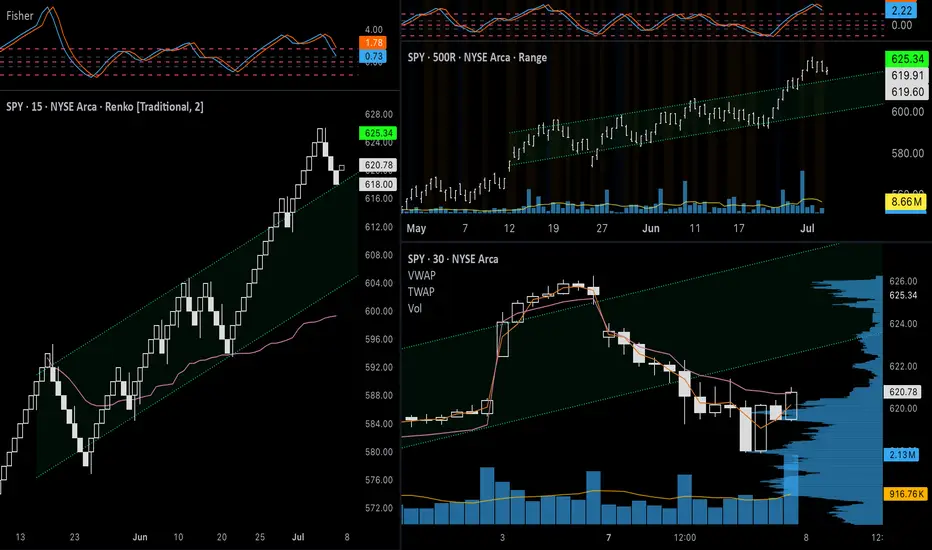
Renko: The price pulled back on Monday, as expected, and may continue lower to retest the top of the channel (around $615). Fisher Transform is still in positive territory and strong support at that level could lead to the price reaching higher highs.

500R ($5) chart: Similar structure to the Renko chart. I’m using a higher range here to compensate for volatility. Just like with the Renko chart, a bounce on the top of the channel would be a healthy pullback before higher highs. There is a high volume node on the volume profile, so interest from buyers here could be strong enough to prevent the price from falling back into the channel.

4h chart: The last three candles have the appearance of a healthy pullback. There was declining volume and
the most recent candle is somewhat of a bullish hammer. I also have an anchored VWAP going back to June 30 that the price seems to be respecting. The price bounced off of it in the first 4h candle on Monday and managed to close above it after a dip during the formation of the second candle.
+++++++++++++++++++++++++++
Bearish Analysis

Renko: Same chart with a lower box size ($1 instead of $2). As you can see, there is bearish divergence on Fisher Transform. The price also found likely temporary support before reaching the top of the channel, suggesting that it could make at least one more wave down if a larger corrective trend unfolds. The 1.382 ($614) and 1.618 ($612) Fibonacci extensions will be important reference points to watch. I would feel less confident about the strength of the bullish trend if the price goes beyond the 1.618 extension.

200R ($2) Range: The Range chart in this layout is the only one that I am including extended hours data on, so the channels have slightly different levels. On this chart I am using two trend lines on the upper level to illustrate the possible areas of support/previous resistance. If the price breaks back into the channel and below the 34VWMA, it could signal a trend failure and the price could return to $600 or lower. Volume bars on range charts also offer a different perspective than on time-based candlesticks. Here, since each bar represents a $2 move up or down, the volume inside of each bar can show the level of effort it took to move the price either direction, whereas the time-based charts are simply showing the level of interest during a particular time period. For this reason, consistently high volume during this last move up could be a sign that there is a larger presence of sellers. Lastly, there is Fisher Transform divergence here as well.

1h chart: ES1! is green overnight, signaling continuation of the bounce we saw at the end of the day on Monday. With a tighter channel, the top was rejected in a classic bearish reversal candle pattern above the channel and made a clean break down below the channel. The price found support just above the anchored VWAP from the start of the channel, so there could still be institutional interest around $617 and below. If this correction were to unfold into three distinct waves, a 0.618 pullback (to the 0.382 level of the fib extension; $623) would retest the previous demand of the channel. A rejection here could have the price looking for support in a lower volume zone. A (c) wave could take the price down to $615-$611.
+++++++++++++++++++++++++++
Options Analysis

As I have explained, I think it is possible that we will see the price hit $623 during the Tuesday session, so it could be an important level for ATM options. VIX held its level on Monday after the gap up but failed to make progress - finding resistance at the 200MA on the 1h chart. The rounding bottom and bullish candles on the 30m
  SPY chart looks better than other timeframes. From a Wyckoff Method perspective, however, it looks like puts are in a distribution pattern and calls are in accumulation. Volume is low for both of these contracts, but especially lower on the Put option, indicating lack of interest.
If the put contract makes a lower low on Tuesday (below $3.55 or above $620.75 for SPY), this particular contract could break into a downtrend. Calls seem to be the safer bet since the price has already made a higher high and has wider support. An ideal entry would be a false breakout at $0.95 ($621.00 for SPY) or a retest of the top of the channel after a true upside breakout at $1.50 ($622.50 for SPY) The upside breakout possibility would have stronger confirmation, so it would be worth the higher premium price. This movement would need to be accompanied by high volume, of course.
For puts, I would like to see higher volume at the bottom of the range, since it seems like the underlying price will open higher. I would probably switch to a contract with a lower strike since $623 would be ITM but for the sake of this idea, I would target entry of $623p around $3.65 ($620.75 for SPY).
+++++++++++++++++++++++++++
Targets
Calls: Enter $622.50, Target $628-$630, Stop Loss $621
Puts: Enter: $620.75, Target $615, Stop Loss $621.50
To summarize, I like the risk/reward and volume better for calls, and it fits my original thesis, however if volume increases on puts at these elevated levels, it will be important to get in at a price that minimizes risk exposure to take advantage of a deeper correction.
Day 2 of journaling my trades. Ended Monday green but not without mistakes. I am heading into Tuesday with more of a neutral outlook. Previous resistance will be tested as support and could find buyers or fail to do so. As I did yesterday, I will give a breakdown of what I’m seeing on all of my charts for both strategies.
+++++++++++++++++++++++++++
Bullish Analysis
Renko: The price pulled back on Monday, as expected, and may continue lower to retest the top of the channel (around $615). Fisher Transform is still in positive territory and strong support at that level could lead to the price reaching higher highs.
500R ($5) chart: Similar structure to the Renko chart. I’m using a higher range here to compensate for volatility. Just like with the Renko chart, a bounce on the top of the channel would be a healthy pullback before higher highs. There is a high volume node on the volume profile, so interest from buyers here could be strong enough to prevent the price from falling back into the channel.
4h chart: The last three candles have the appearance of a healthy pullback. There was declining volume and
the most recent candle is somewhat of a bullish hammer. I also have an anchored VWAP going back to June 30 that the price seems to be respecting. The price bounced off of it in the first 4h candle on Monday and managed to close above it after a dip during the formation of the second candle.
+++++++++++++++++++++++++++
Bearish Analysis
Renko: Same chart with a lower box size ($1 instead of $2). As you can see, there is bearish divergence on Fisher Transform. The price also found likely temporary support before reaching the top of the channel, suggesting that it could make at least one more wave down if a larger corrective trend unfolds. The 1.382 ($614) and 1.618 ($612) Fibonacci extensions will be important reference points to watch. I would feel less confident about the strength of the bullish trend if the price goes beyond the 1.618 extension.
200R ($2) Range: The Range chart in this layout is the only one that I am including extended hours data on, so the channels have slightly different levels. On this chart I am using two trend lines on the upper level to illustrate the possible areas of support/previous resistance. If the price breaks back into the channel and below the 34VWMA, it could signal a trend failure and the price could return to $600 or lower. Volume bars on range charts also offer a different perspective than on time-based candlesticks. Here, since each bar represents a $2 move up or down, the volume inside of each bar can show the level of effort it took to move the price either direction, whereas the time-based charts are simply showing the level of interest during a particular time period. For this reason, consistently high volume during this last move up could be a sign that there is a larger presence of sellers. Lastly, there is Fisher Transform divergence here as well.
1h chart:
+++++++++++++++++++++++++++
Options Analysis
As I have explained, I think it is possible that we will see the price hit $623 during the Tuesday session, so it could be an important level for ATM options.
If the put contract makes a lower low on Tuesday (below $3.55 or above $620.75 for SPY), this particular contract could break into a downtrend. Calls seem to be the safer bet since the price has already made a higher high and has wider support. An ideal entry would be a false breakout at $0.95 ($621.00 for SPY) or a retest of the top of the channel after a true upside breakout at $1.50 ($622.50 for SPY) The upside breakout possibility would have stronger confirmation, so it would be worth the higher premium price. This movement would need to be accompanied by high volume, of course.
For puts, I would like to see higher volume at the bottom of the range, since it seems like the underlying price will open higher. I would probably switch to a contract with a lower strike since $623 would be ITM but for the sake of this idea, I would target entry of $623p around $3.65 ($620.75 for SPY).
+++++++++++++++++++++++++++
Targets
Calls: Enter $622.50, Target $628-$630, Stop Loss $621
Puts: Enter: $620.75, Target $615, Stop Loss $621.50
To summarize, I like the risk/reward and volume better for calls, and it fits my original thesis, however if volume increases on puts at these elevated levels, it will be important to get in at a price that minimizes risk exposure to take advantage of a deeper correction.
免責聲明
這些資訊和出版物並不意味著也不構成TradingView提供或認可的金融、投資、交易或其他類型的意見或建議。請在使用條款閱讀更多資訊。