After months of downward pressure, VANRY/USDT has finally shown a strong technical breakout, potentially marking a shift in momentum and the beginning of a bullish phase.
📊 Technical Pattern & Market Structure
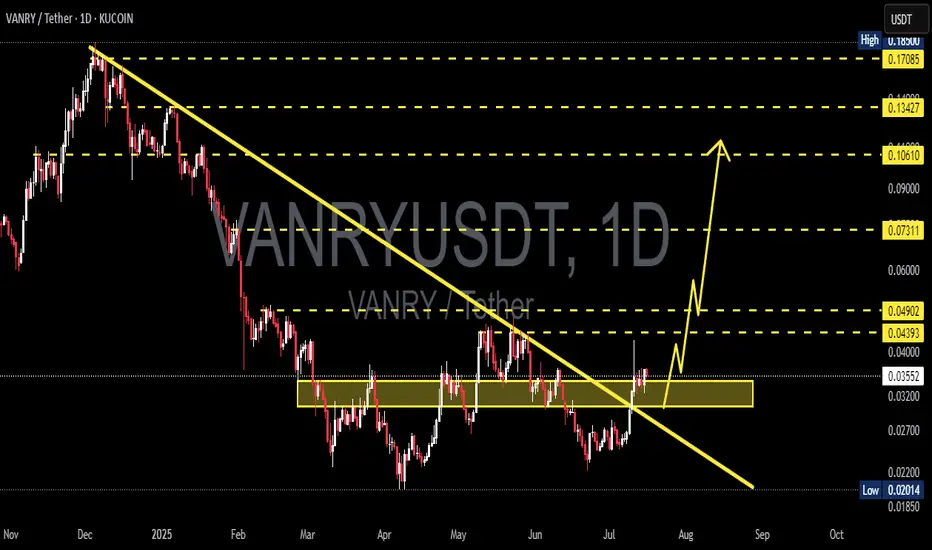
🔻 1. Descending Trendline Breakout
Price has successfully broken above a long-term descending trendline that has capped the market since November 2024. This breakout is a key signal of a potential trend reversal, suggesting the sellers are losing control.
🟨 2. Accumulation Zone Breakout
For over 3 months, the price consolidated within a clear accumulation zone between 0.02600 – 0.03300 USDT. The breakout from this zone indicates that accumulation may be complete, and price is now entering a markup phase.
🔁 3. Retest Confirmation
After the breakout, VANRY has successfully retested the previous resistance as new support (0.03300 – 0.03500), confirming the breakout as valid. This is often considered a textbook bullish setup.
✅ Bullish Scenario
As long as the price holds above the breakout zone, the bullish outlook remains intact. Key resistance levels to watch:
Target Price Level Notes
🎯 Target 1 0.04393 USDT Minor resistance
🎯 Target 2 0.04902 USDT Key psychological level
🎯 Target 3 0.07311 USDT Mid-term bullish target
🎯 Target 4 0.10610 – 0.13427 USDT Long-term rally potential
🚀 Final Target 0.17085 USDT Previous swing high
> As long as price sustains above 0.035, these targets remain highly achievable in the coming weeks.
❌ Bearish Scenario
In case of a failed breakout or rejection from key resistances, the bearish case still exists:
🔻 Drop below 0.03200 could signal a failed breakout
📉 Downside targets: 0.02700 → 0.02200 → 0.02014 (strong historical support)
⚠️ Daily close below 0.03100 confirms a potential fakeout
🎯 Trading Strategy & Risk Management
Ideal Entry Zone:
→ Retest range of 0.03300 – 0.03550
Stop Loss:
→ Below 0.03100 (invalidates bullish thesis)
Take Profit Levels:
→ Scale out profits at 0.043 / 0.049 / 0.073 / 0.106 etc.
> Using a trailing stop or scaling out strategy can maximize profits as the trend develops.
🔍 Technical Summary
This is a classic Breakout + Retest setup. The combination of trendline breakout, horizontal resistance flip, and retest creates a high-probability bullish pattern.
From a Wyckoff perspective, this could be the transition from accumulation to markup phase, especially if volume increases.
📢 DISCLAIMER:
This analysis is for educational purposes only and does not constitute financial advice. Always do your own research and manage risk accordingly.
#VANRY #VANRYUSDT #CryptoBreakout #AltcoinSetup #BullishRetest #DescendingTrendlineBreakout #CryptoTechnicalAnalysis #WyckoffAccumulation #BreakoutStrategy
✅ Get Free Signals! Join Our Telegram Channel Here: t.me/TheCryptoNuclear
✅ Twitter: twitter.com/crypto_nuclear
✅ Join Bybit : partner.bybit.com/b/nuclearvip
✅ Benefits : Lifetime Trading Fee Discount -50%
✅ Twitter: twitter.com/crypto_nuclear
✅ Join Bybit : partner.bybit.com/b/nuclearvip
✅ Benefits : Lifetime Trading Fee Discount -50%
免責聲明
這些資訊和出版物並不意味著也不構成TradingView提供或認可的金融、投資、交易或其他類型的意見或建議。請在使用條款閱讀更多資訊。