🟡 Chart Overview:
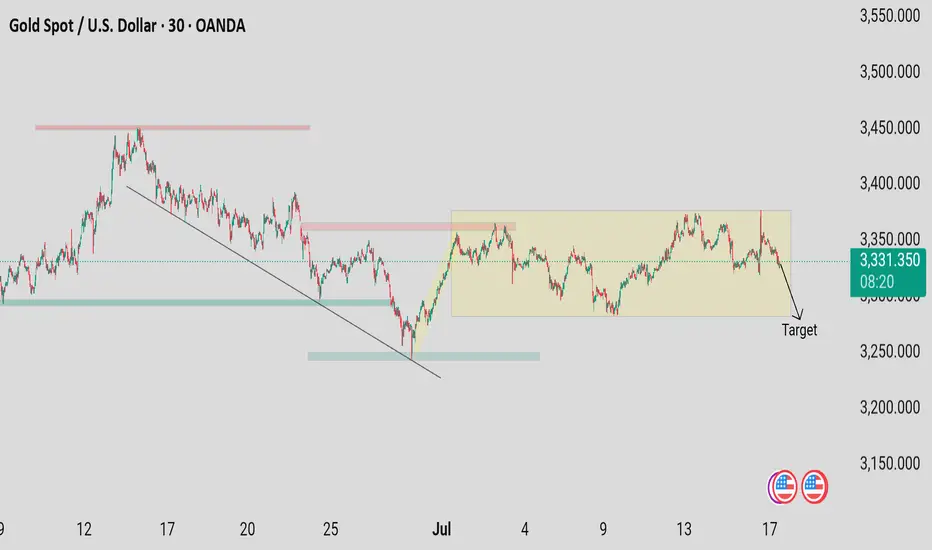
The image shows XAU/USD (Gold) price action breaking down from a bearish descending channel, signaling a continuation of downward momentum.
---
🔍 Technical Analysis:
1. Trend Structure:
The market was respecting a descending channel, consistently making lower highs and lower lows.
A clear break below the channel support indicates a strong bearish bias.
2. Key Breakdown Level:
The lower trendline of the channel was broken with strong momentum, showing sellers' dominance.
This is often followed by a retest of the broken trendline (as new resistance).
3. Support & Target Zones:
Immediate support zone: $2,390
Extended bearish target: $2,375–$2,365
These levels align with historical price reactions and Fibonacci confluences.
4. Volume & Candlestick Behavior:
Large-bodied bearish candles confirm strong sell pressure.
No signs of reversal (like hammer or bullish engulfing) yet.
---
✅ Conclusion & Strategy:
Bias: Bearish
Strategy: Wait for a minor pullback/retest of the broken channel, then consider short positions with tight stops.
Target Levels: $2,390 > $2,375
Stop Loss: Above the retest area, around $2,410–$2,415
交易進行
🔗 t.me/+VTrdWh5R_scwMGM0
✅ All PAIRS SIGNALS PROVIDE FIRST VISIT THEN JOIN
🔗 t.me/+jODseb0iIvxiNjc0
✅ REGISTER UNDER THE WORLD BEST BROKER
🔗 one.exnesstrack.org/a/6yzdfvn1po
✅ All PAIRS SIGNALS PROVIDE FIRST VISIT THEN JOIN
🔗 t.me/+jODseb0iIvxiNjc0
✅ REGISTER UNDER THE WORLD BEST BROKER
🔗 one.exnesstrack.org/a/6yzdfvn1po
免責聲明
這些資訊和出版物並不意味著也不構成TradingView提供或認可的金融、投資、交易或其他類型的意見或建議。請在使用條款閱讀更多資訊。