PROTECTED SOURCE SCRIPT
已更新 Nexural ORB
Nexural ORB - Multi-Timeframe Opening Range Breakout Indicator
Introduction
This indicator was built out of frustration. After testing dozens of ORB tools, both free and paid, I found that most of them either did too little or cluttered the chart with unnecessary information. The Opening Range Breakout is one of the oldest and most reliable intraday strategies, yet most indicators treat it as an afterthought - just a box on the chart with no context.
This is not that kind of indicator.
The Nexural Ultimate ORB tracks the Opening Range across three timeframes simultaneously, provides quality scoring to help you identify high-probability setups, detects when multiple levels align for confluence, and now includes historical ORB data so you can scroll back and review previous sessions. It does not tell you when to buy or sell. It does not promise profits. What it does is give you clean, accurate levels with the context you need to make informed decisions.
I am going to be completely transparent about what this indicator does, how it works, what it does well, and where it falls short. If you are looking for a magic solution that prints money, this is not it. If you are looking for a professional-grade tool that will become a permanent part of your charting setup, keep reading.
What Is The Opening Range Breakout
Before diving into the indicator itself, let me explain the strategy it is built around.
The Opening Range is simply the high and low price established during the first portion of the trading session. For US equities and futures, this typically begins at 9:30 AM Eastern Time. The theory behind trading the Opening Range is straightforward: the first 15, 30, or 60 minutes of trade often sets the tone for the rest of the day. Institutional traders, algorithms, and market makers are all actively positioning during this window, and the levels they establish become reference points for the remainder of the session.
When price breaks above the Opening Range High, it suggests bullish momentum and the potential for continuation higher. When price breaks below the Opening Range Low, it suggests bearish momentum and the potential for continuation lower. The strategy has been used by floor traders for decades and remains relevant today because the underlying market dynamics have not changed - the open is when the most information gets priced in, and the levels established during that period matter.
This indicator does not trade the ORB for you. It identifies the levels, tracks multiple timeframes, and provides context. The actual trading decisions are yours.
How The Opening Range Is Calculated
The indicator calculates the Opening Range for three timeframes:
The 15-Minute ORB captures the high and low from 9:30 AM to 9:45 AM. This is the shortest timeframe and typically produces the tightest range. Breakouts from the 15-minute ORB tend to occur earliest in the session and can provide early directional signals, though they are also more prone to false breakouts due to the narrow range.
The 30-Minute ORB captures the high and low from 9:30 AM to 10:00 AM. This is considered by many institutional traders to be the most significant timeframe. The 30-minute window allows enough time for the initial volatility to settle while still capturing the core opening activity. Many professional trading desks reference the 30-minute ORB as their primary intraday framework.
The 60-Minute ORB captures the high and low from 9:30 AM to 10:30 AM. This is the widest range and produces fewer signals, but those signals tend to be more reliable. The 60-minute ORB is particularly useful on high-volatility days when the 15 and 30-minute ranges get quickly violated.
The calculation itself is simple. As each bar completes during the opening period, the indicator compares the current high and low to the stored values and updates them if new extremes are reached. Once the timeframe completes, the levels lock in and do not change for the rest of the session.
I want to be absolutely clear about one thing: there is no repainting. The ORB levels are calculated in real-time as the opening period develops. Once a timeframe completes, those levels are final. You will not look back at your chart and see different levels than what appeared in real-time. This is critically important for any indicator you use for actual trading decisions.
Visual Hierarchy and Line Styles
One of the main problems with multi-timeframe indicators is visual clutter. When you have six lines on the chart representing three different ORBs, it becomes difficult to quickly identify which level belongs to which timeframe.
This indicator solves that problem through a clear visual hierarchy. Each timeframe has its own color, line width, and line style, all of which are fully customizable.
By default, the 15-Minute ORB uses solid lines with the heaviest weight. This makes it the most prominent on the chart because it is typically the first level to be tested and often the most actively traded.
The 30-Minute ORB uses dashed lines with a medium weight. This keeps it visible but clearly secondary to the 15-minute levels.
The 60-Minute ORB uses dotted lines with a medium weight. This places it in the background as a reference level rather than an active trading zone.
You can change any of these settings. If you prefer to trade the 30-minute ORB exclusively, you can make it solid and bold while keeping the others subtle. If you only want to see the 60-minute ORB, you can disable the other two entirely. The flexibility is there because every trader has different preferences.
The dashboard in the top right corner of the chart displays the corresponding line style next to each timeframe, so you always know which line on the chart matches which row in the dashboard.
The Quality Scoring System
Not every Opening Range is worth trading. Some days produce tight, clean ranges with strong follow-through. Other days produce wide, choppy ranges that lead to multiple false breakouts. One of the most valuable features of this indicator is the Quality Score, which grades each session from A-plus down to C.
The Quality Score is calculated based on several factors:
Range Size is the most important factor. The indicator compares the current ORB range to the average daily range over the past 20 sessions. A tight range, defined as less than 40 percent of the average daily range, receives the highest score. The logic here is simple: tight ranges indicate consolidation, and consolidation often precedes expansion. When the ORB is tight, a breakout has more room to run.
A normal range, between 40 and 80 percent of the average daily range, receives a moderate score. These are typical trading days without any particular edge from a range perspective.
A wide range, greater than 80 percent of the average daily range, receives the lowest score. When the ORB is already wide, much of the day's move may have already occurred during the opening period, leaving less opportunity for breakout continuation.
Volume is the second factor. Above-average volume during the opening period indicates genuine institutional participation. The indicator compares the current volume to the 20-bar average. Significantly elevated volume adds to the quality score, while below-average volume does not penalize the score but does not help it either.
Day of Week matters more than most traders realize. Statistical studies of market behavior consistently show that Tuesday, Wednesday, and Thursday produce cleaner trending days than Monday or Friday. Monday mornings often see erratic price action as the market digests weekend news and repositions. Friday afternoons often see reduced participation as traders close out positions before the weekend. The quality score reflects these tendencies by adding points for mid-week sessions and subtracting points for Monday mornings and Friday afternoons.
Overnight Activity is relevant primarily for futures traders. If the overnight session produced a significant range, defined as greater than half of the average true range, it suggests that institutions were active during the overnight hours. This often leads to more directional behavior during the regular session.
The quality score is displayed in the dashboard as a letter grade. A-plus indicates excellent conditions across multiple factors. A indicates good conditions. B indicates average conditions. C indicates below-average conditions that warrant caution.
I want to be honest about the limitations of this system. The quality score is a guideline, not a guarantee. A C-rated day can still produce a profitable breakout. An A-plus day can still result in a failed breakout that reverses. The score helps you calibrate your expectations and position sizing, but it does not predict the future.
Confluence Detection
Confluence occurs when multiple significant price levels cluster together within a tight range. When the 15-minute ORB high aligns with the overnight high, or when the ORB low sits right at the session opening price, you have confluence. These zones tend to produce stronger reactions because multiple types of traders are watching the same level.
The indicator automatically detects confluence using a tolerance-based system. By default, the tolerance is set to 0.15 percent of price. This means that if two levels are within 0.15 percent of each other, they are considered confluent.
The levels that are checked for confluence include the Session Opening Price, which is the exact price at 9:30 AM. This level matters because it represents the point where the market transitioned from overnight to regular session trading. Many traders reference the opening print throughout the day.
The Overnight High and Low are also checked. For futures markets, this includes all trading from 6:00 PM the previous evening through 9:29 AM. For stocks, this includes extended hours trading. These levels represent the extremes established before the regular session began.
Finally, the indicator checks whether the ORB levels from different timeframes align with each other. When the 15-minute high matches the 30-minute high, that level gains additional significance.
When confluence is detected, two things happen on the chart. First, the affected ORB line changes color to gold, making it visually obvious that this level has additional significance. Second, the dashboard displays a Confluence row at the bottom, alerting you to the condition.
The Confluence label also appears directly on the chart, positioned within the ORB zone so you can immediately see where the confluence exists.
Smart Label System
A common problem with indicators that display multiple price levels is label overlap. When you have six ORB levels plus auxiliary levels like the session open and overnight high and low, the right side of the chart can become a cluttered mess of overlapping text.
This indicator solves that problem with a smart labeling system that combines matching levels. If the 15-minute low, 30-minute low, and 60-minute low are all at the same price, instead of displaying three separate labels, the indicator displays a single label that reads 15L/30L/60L followed by the price.
The system uses a tolerance of 2 percent of the ORB range to determine whether levels are close enough to combine. This keeps the labels clean while still displaying separate labels when levels are meaningfully different.
The labels are positioned to the right of the current price action, extending beyond the last bar so they remain visible as new bars form. Each label includes the level identifier and the exact price value.
Historical ORB Display
This feature addresses one of the most common limitations of ORB indicators: the inability to see previous sessions when scrolling back through your chart.
With the history feature enabled, the indicator stores ORB data for up to 20 previous sessions. When you scroll back in time, you will see the ORB levels for each historical session, drawn from the session start to the session end.
Historical ORBs are displayed with slightly faded colors, using 50 percent transparency compared to the current session. This creates a clear visual distinction between current and historical levels while still allowing you to analyze past price action relative to those levels.
The history depth is configurable. You can set it anywhere from 1 to 20 days depending on your needs. If you primarily care about the current session and the previous day for context, set it to 1 or 2. If you want to analyze an entire week or more of ORB behavior, increase the setting.
You can also disable the history feature entirely by enabling Current Session Only mode. This returns the indicator to showing only the active session, which some traders prefer for a cleaner chart during live trading.
Breakout Detection and Filters
The indicator marks breakouts with triangle signals. A green triangle below the bar indicates a bullish breakout above the ORB high. A red triangle above the bar indicates a bearish breakout below the ORB low.
However, not every crossing of an ORB level represents a valid breakout worth acting on. The indicator includes several filters to reduce false signals.
The Volume Filter requires that volume on the breakout bar be at least 1.2 times the 20-bar average volume. You can adjust this multiplier in the settings. The logic is straightforward: breakouts on weak volume are more likely to fail. A genuine breakout that is going to follow through should be accompanied by above-average participation.
The Time Filter prevents breakout signals after a specified hour. The default is 2:00 PM Eastern. The rationale is that late-session breakouts often lack follow-through because there is not enough trading time remaining for the move to develop. You can adjust or disable this filter based on your trading style.
The Single Trigger mechanism ensures that each breakout fires exactly once per session. If price crosses above the ORB high, you will see one bullish signal on the bar where the crossing occurred. If price subsequently pulls back and crosses above again, you will not see a second signal. This prevents signal spam and keeps your chart clean.
The indicator also includes Reclaim Detection. If price breaks out and then returns back inside the ORB zone, you will see a warning signal marked with an X. This condition often indicates a failed breakout and potential reversal. It is not a trade signal, but rather information that the breakout you just witnessed may not be valid.
Range Extensions
Once the ORB is established, many traders look for profit targets based on the range itself. The indicator includes extension levels that project multiples of the ORB range above and below the extremes.
By default, two extension levels are shown: 1.0 times the range and 1.5 times the range. If the 15-minute ORB is 50 points, the 1.0 extension above the high would be 50 points above the high, and the 1.5 extension would be 75 points above the high.
These extensions serve as potential profit targets for breakout trades. The 1.0 extension represents a measured move equal to the ORB itself. The 1.5 extension represents a slightly more ambitious target.
You can adjust the extension multipliers in the settings. Some traders prefer 0.5 and 1.0. Others prefer 1.0 and 2.0. The flexibility is there to match your trading approach.
The extension lines are displayed as faint dotted lines so they do not compete visually with the ORB levels themselves. The labels show the multiplier value along with the exact price.
## The Midline
The 50 percent level of the ORB, known as the midline, is displayed as a dashed line within the ORB zone. This level matters because it often acts as short-term support or resistance during consolidation periods within the range.
When price is trading inside the ORB and approaches the midline, you may see a reaction. The midline can also serve as a reference for whether price is showing strength or weakness within the range. If price is spending most of its time above the midline, that suggests a bullish bias even before a breakout occurs. If price is spending most of its time below the midline, that suggests a bearish bias.
The midline can be disabled in the settings if you prefer a cleaner chart.
The Dashboard
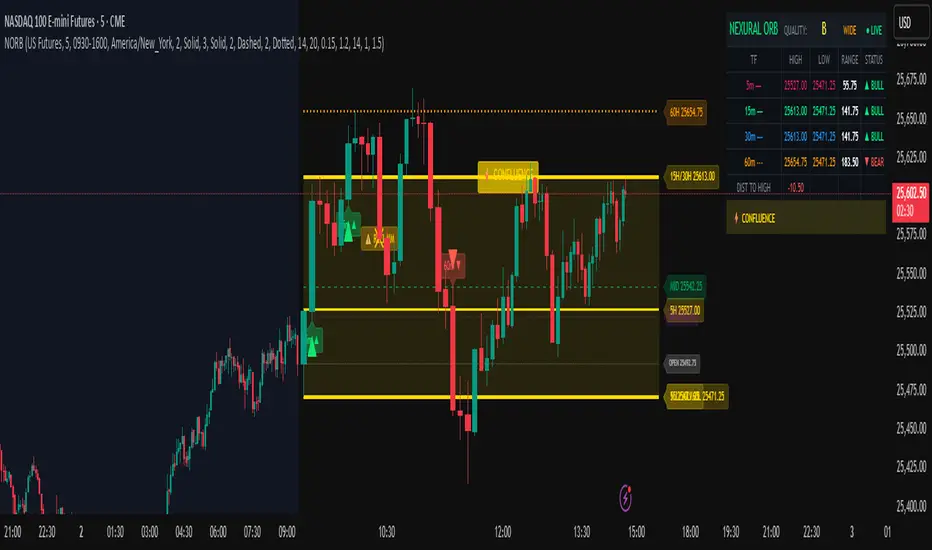
The dashboard is positioned in the top right corner of the chart and provides all relevant ORB information at a glance.
The header row displays the indicator name, the current Quality Score grade, the Range Classification, and the Session Status.
The Range Classification shows whether the current 15-minute ORB is Tight, Normal, or Wide compared to the 20-day average. This gives you immediate context about whether the range is unusual in either direction.
The Session Status shows whether the market is currently in session or closed. A green Live indicator means the session is active. A red Closed indicator means the session has ended.
Below the header, each timeframe row displays the following information:
The Timeframe column shows 15m, 30m, or 60m along with a visual indicator of the line style you have selected for that timeframe.
The High column displays the ORB high price for that timeframe.
The Low column displays the ORB low price for that timeframe.
The Range column displays the distance between high and low.
The Status column shows the current state. Before the ORB completes, this shows a countdown of minutes remaining. After completion, it shows whether the price has broken out bullish, broken out bearish, or remains in range.
Below the timeframe rows, the Distance row shows how far the current price is from the nearest ORB level. This helps you gauge whether price is approaching a potential breakout zone.
If confluence is detected, a highlighted row appears at the bottom of the dashboard indicating that significant level alignment exists.
Supported Markets and Sessions
The indicator supports multiple market types with appropriate session times:
US Stocks use a session from 9:30 AM to 4:00 PM Eastern.
US Futures use a session from 9:30 AM to 4:00 PM Eastern, with overnight tracking from 6:00 PM the previous evening.
Forex uses a 24-hour session since the market trades continuously.
Crypto uses a 24-hour session since the market trades continuously.
Custom allows you to define your own session times for markets not covered by the presets.
The timezone is configurable. The default is America/New_York, but you can change it to Chicago, Los Angeles, London, Tokyo, or UTC depending on your location and preference.
Settings Overview
The settings are organized into logical groups:
General settings include the market type, current session only toggle, and history days.
Session settings include custom session times and timezone selection.
ORB Timeframes settings include individual toggles for showing or hiding each timeframe, color selection, line width, and line style. This is where you customize the visual appearance of each ORB level.
Quality Scoring settings include the ATR period and range comparison lookback. These affect how the quality score is calculated.
Confluence Detection settings include the tolerance percentage and toggles for the session open and overnight high and low levels.
Breakout Settings include the volume filter toggle and multiplier, time filter toggle and cutoff hour, and reclaim detection toggle.
Visuals settings include toggles for the fill zone, labels, dashboard, distance display, and midline.
Extensions settings include toggles for showing extensions and the multiplier values for each extension level.
How I Use This Indicator
I will share my personal approach, though you should adapt it to your own style.
First, I wait for the ORB to complete. I do not trade during the first 15 to 30 minutes of the session. The levels are still forming, and the price action during this window is often erratic. I let the dust settle and the range establish itself.
Second, I check the Quality Score. If it is an A or A-plus day with a tight range and good volume, I am more aggressive. If it is a C day with a wide range on a Friday afternoon, I am either sitting on my hands or trading with reduced size.
Third, I look for confluence. If the 15-minute high is sitting right at the overnight high, that level has additional significance. Breakouts through confluence zones tend to be more decisive.
Fourth, I confirm with volume. Even though the indicator filters for volume, I still glance at the volume bars. I want to see that breakout candle have conviction.
Fifth, I manage expectations based on range type. If the ORB is tight, I expect an explosive move and give the trade room to develop. If the ORB is wide, I expect choppier action and tighten my parameters.
Sixth, I use the distance reading. If price is already 50 points beyond the ORB high and the range was only 40 points, I have missed the move. Chasing extended price is not smart trading.
Honest Pros and Cons
What this indicator does well:
It provides clean, accurate ORB levels that do not repaint. This is the foundation, and it is done correctly.
It offers multi-timeframe tracking with clear visual differentiation. You can see all three ORBs at once without confusion.
The quality scoring system helps you avoid low-probability setups. It is not perfect, but it adds valuable context.
The confluence detection highlights significant level alignment automatically. This saves you from manually checking multiple levels.
The smart label system prevents visual clutter. Labels combine when appropriate and remain readable.
The historical ORB display allows you to scroll back and review previous sessions. This is valuable for analysis and pattern recognition.
The customization is extensive. Every visual element can be adjusted to match your preferences.
It works across stocks, futures, forex, and crypto with appropriate session handling.
What this indicator does not do:
It does not give you buy and sell signals with entries and exits. This is a levels and analysis tool, not a trading system.
It does not include backtesting or performance tracking. You need a separate strategy tester for that.
It does not guarantee that breakouts will follow through. The filters help, but failed breakouts still occur.
The quality score is a guideline, not a prediction. Low-quality days can still produce good trades. High-quality days can still produce losing trades.
The confluence detection is proximity-based. It identifies when levels are near each other but does not know if those levels are actually significant to other traders.
Technical limitations to be aware of:
On chart timeframes larger than 15 minutes, the ORB calculation becomes less precise because you have fewer bars in the opening period. This indicator works best on 1 to 15 minute charts.
The overnight high and low tracking works best on futures. Stocks do not have true overnight sessions in the same way.
If your chart does not have volume data, the volume filter will not function properly.
Risk Management
This section is not about the indicator. It is about trading.
No indicator, no matter how well designed, can protect you from poor risk management. Before you trade any ORB breakout, you need to define your risk.
Where is your stop? A common approach is to place the stop on the opposite side of the ORB zone. If you are taking a bullish breakout above the high, your stop goes below the low. This means your risk is the full ORB range plus any slippage.
Is that risk acceptable? If the ORB range is 100 points and you are trading a 50 dollar per point contract, your risk is 5000 dollars plus commissions. Can you afford that loss? If not, either reduce your size or skip the trade.
Where is your target? The extensions provide potential targets, but you need to decide in advance where you will take profits. Hoping for an unlimited run while watching your profits evaporate is not a strategy.
What is your win rate? ORB breakouts do not work every time. Depending on the market and conditions, you might win 50 to 60 percent of the time. That means you will have losing trades. Are you prepared for a string of three or four losers in a row? It will happen.
None of this is specific to this indicator. It applies to all trading. But I include it here because I see too many traders focus on the indicator while ignoring the fundamentals of risk management. The indicator can help you identify setups. It cannot manage your risk for you.
Final Thoughts
I built this indicator for my own trading, then refined it to the point where I felt comfortable sharing it. It is not a holy grail. It will not make you profitable if you do not already have a trading process. What it will do is give you clean, accurate ORB levels with context that most indicators do not provide.
The Opening Range Breakout works because institutions and algorithms reference these same levels. When the first 30 or 60 minutes of trading establishes a range, that becomes a reference point for the rest of the session. This indicator makes those levels visible and adds intelligence around when they are worth paying attention to.
Use it as a tool, not a crutch. Combine it with your own analysis. Manage your risk properly. And please, do not trade with money you cannot afford to lose.
If you have questions or feedback, I am actively maintaining this indicator and will consider feature requests for future updates.
Trade well.
Tags
ORB, Opening Range Breakout, Intraday, Day Trading, Futures, Stocks, Multi-Timeframe, Breakout, Support Resistance, Session, NQ, ES, SPY, QQQ, Opening Range, Institutional Levels
Recommended Timeframes
This indicator works best on 1-minute, 2-minute, 3-minute, 5-minute, 10-minute, and 15-minute charts. It can be used on higher timeframes, but the ORB calculation becomes less precise.
Recommended Markets
US Stock Indices and Futures including ES, NQ, YM, RTY, SPY, QQQ, DIA, IWM. Individual stocks with sufficient liquidity. Forex major pairs. Cryptocurrency with defined trading sessions.
Introduction
This indicator was built out of frustration. After testing dozens of ORB tools, both free and paid, I found that most of them either did too little or cluttered the chart with unnecessary information. The Opening Range Breakout is one of the oldest and most reliable intraday strategies, yet most indicators treat it as an afterthought - just a box on the chart with no context.
This is not that kind of indicator.
The Nexural Ultimate ORB tracks the Opening Range across three timeframes simultaneously, provides quality scoring to help you identify high-probability setups, detects when multiple levels align for confluence, and now includes historical ORB data so you can scroll back and review previous sessions. It does not tell you when to buy or sell. It does not promise profits. What it does is give you clean, accurate levels with the context you need to make informed decisions.
I am going to be completely transparent about what this indicator does, how it works, what it does well, and where it falls short. If you are looking for a magic solution that prints money, this is not it. If you are looking for a professional-grade tool that will become a permanent part of your charting setup, keep reading.
What Is The Opening Range Breakout
Before diving into the indicator itself, let me explain the strategy it is built around.
The Opening Range is simply the high and low price established during the first portion of the trading session. For US equities and futures, this typically begins at 9:30 AM Eastern Time. The theory behind trading the Opening Range is straightforward: the first 15, 30, or 60 minutes of trade often sets the tone for the rest of the day. Institutional traders, algorithms, and market makers are all actively positioning during this window, and the levels they establish become reference points for the remainder of the session.
When price breaks above the Opening Range High, it suggests bullish momentum and the potential for continuation higher. When price breaks below the Opening Range Low, it suggests bearish momentum and the potential for continuation lower. The strategy has been used by floor traders for decades and remains relevant today because the underlying market dynamics have not changed - the open is when the most information gets priced in, and the levels established during that period matter.
This indicator does not trade the ORB for you. It identifies the levels, tracks multiple timeframes, and provides context. The actual trading decisions are yours.
How The Opening Range Is Calculated
The indicator calculates the Opening Range for three timeframes:
The 15-Minute ORB captures the high and low from 9:30 AM to 9:45 AM. This is the shortest timeframe and typically produces the tightest range. Breakouts from the 15-minute ORB tend to occur earliest in the session and can provide early directional signals, though they are also more prone to false breakouts due to the narrow range.
The 30-Minute ORB captures the high and low from 9:30 AM to 10:00 AM. This is considered by many institutional traders to be the most significant timeframe. The 30-minute window allows enough time for the initial volatility to settle while still capturing the core opening activity. Many professional trading desks reference the 30-minute ORB as their primary intraday framework.
The 60-Minute ORB captures the high and low from 9:30 AM to 10:30 AM. This is the widest range and produces fewer signals, but those signals tend to be more reliable. The 60-minute ORB is particularly useful on high-volatility days when the 15 and 30-minute ranges get quickly violated.
The calculation itself is simple. As each bar completes during the opening period, the indicator compares the current high and low to the stored values and updates them if new extremes are reached. Once the timeframe completes, the levels lock in and do not change for the rest of the session.
I want to be absolutely clear about one thing: there is no repainting. The ORB levels are calculated in real-time as the opening period develops. Once a timeframe completes, those levels are final. You will not look back at your chart and see different levels than what appeared in real-time. This is critically important for any indicator you use for actual trading decisions.
Visual Hierarchy and Line Styles
One of the main problems with multi-timeframe indicators is visual clutter. When you have six lines on the chart representing three different ORBs, it becomes difficult to quickly identify which level belongs to which timeframe.
This indicator solves that problem through a clear visual hierarchy. Each timeframe has its own color, line width, and line style, all of which are fully customizable.
By default, the 15-Minute ORB uses solid lines with the heaviest weight. This makes it the most prominent on the chart because it is typically the first level to be tested and often the most actively traded.
The 30-Minute ORB uses dashed lines with a medium weight. This keeps it visible but clearly secondary to the 15-minute levels.
The 60-Minute ORB uses dotted lines with a medium weight. This places it in the background as a reference level rather than an active trading zone.
You can change any of these settings. If you prefer to trade the 30-minute ORB exclusively, you can make it solid and bold while keeping the others subtle. If you only want to see the 60-minute ORB, you can disable the other two entirely. The flexibility is there because every trader has different preferences.
The dashboard in the top right corner of the chart displays the corresponding line style next to each timeframe, so you always know which line on the chart matches which row in the dashboard.
The Quality Scoring System
Not every Opening Range is worth trading. Some days produce tight, clean ranges with strong follow-through. Other days produce wide, choppy ranges that lead to multiple false breakouts. One of the most valuable features of this indicator is the Quality Score, which grades each session from A-plus down to C.
The Quality Score is calculated based on several factors:
Range Size is the most important factor. The indicator compares the current ORB range to the average daily range over the past 20 sessions. A tight range, defined as less than 40 percent of the average daily range, receives the highest score. The logic here is simple: tight ranges indicate consolidation, and consolidation often precedes expansion. When the ORB is tight, a breakout has more room to run.
A normal range, between 40 and 80 percent of the average daily range, receives a moderate score. These are typical trading days without any particular edge from a range perspective.
A wide range, greater than 80 percent of the average daily range, receives the lowest score. When the ORB is already wide, much of the day's move may have already occurred during the opening period, leaving less opportunity for breakout continuation.
Volume is the second factor. Above-average volume during the opening period indicates genuine institutional participation. The indicator compares the current volume to the 20-bar average. Significantly elevated volume adds to the quality score, while below-average volume does not penalize the score but does not help it either.
Day of Week matters more than most traders realize. Statistical studies of market behavior consistently show that Tuesday, Wednesday, and Thursday produce cleaner trending days than Monday or Friday. Monday mornings often see erratic price action as the market digests weekend news and repositions. Friday afternoons often see reduced participation as traders close out positions before the weekend. The quality score reflects these tendencies by adding points for mid-week sessions and subtracting points for Monday mornings and Friday afternoons.
Overnight Activity is relevant primarily for futures traders. If the overnight session produced a significant range, defined as greater than half of the average true range, it suggests that institutions were active during the overnight hours. This often leads to more directional behavior during the regular session.
The quality score is displayed in the dashboard as a letter grade. A-plus indicates excellent conditions across multiple factors. A indicates good conditions. B indicates average conditions. C indicates below-average conditions that warrant caution.
I want to be honest about the limitations of this system. The quality score is a guideline, not a guarantee. A C-rated day can still produce a profitable breakout. An A-plus day can still result in a failed breakout that reverses. The score helps you calibrate your expectations and position sizing, but it does not predict the future.
Confluence Detection
Confluence occurs when multiple significant price levels cluster together within a tight range. When the 15-minute ORB high aligns with the overnight high, or when the ORB low sits right at the session opening price, you have confluence. These zones tend to produce stronger reactions because multiple types of traders are watching the same level.
The indicator automatically detects confluence using a tolerance-based system. By default, the tolerance is set to 0.15 percent of price. This means that if two levels are within 0.15 percent of each other, they are considered confluent.
The levels that are checked for confluence include the Session Opening Price, which is the exact price at 9:30 AM. This level matters because it represents the point where the market transitioned from overnight to regular session trading. Many traders reference the opening print throughout the day.
The Overnight High and Low are also checked. For futures markets, this includes all trading from 6:00 PM the previous evening through 9:29 AM. For stocks, this includes extended hours trading. These levels represent the extremes established before the regular session began.
Finally, the indicator checks whether the ORB levels from different timeframes align with each other. When the 15-minute high matches the 30-minute high, that level gains additional significance.
When confluence is detected, two things happen on the chart. First, the affected ORB line changes color to gold, making it visually obvious that this level has additional significance. Second, the dashboard displays a Confluence row at the bottom, alerting you to the condition.
The Confluence label also appears directly on the chart, positioned within the ORB zone so you can immediately see where the confluence exists.
Smart Label System
A common problem with indicators that display multiple price levels is label overlap. When you have six ORB levels plus auxiliary levels like the session open and overnight high and low, the right side of the chart can become a cluttered mess of overlapping text.
This indicator solves that problem with a smart labeling system that combines matching levels. If the 15-minute low, 30-minute low, and 60-minute low are all at the same price, instead of displaying three separate labels, the indicator displays a single label that reads 15L/30L/60L followed by the price.
The system uses a tolerance of 2 percent of the ORB range to determine whether levels are close enough to combine. This keeps the labels clean while still displaying separate labels when levels are meaningfully different.
The labels are positioned to the right of the current price action, extending beyond the last bar so they remain visible as new bars form. Each label includes the level identifier and the exact price value.
Historical ORB Display
This feature addresses one of the most common limitations of ORB indicators: the inability to see previous sessions when scrolling back through your chart.
With the history feature enabled, the indicator stores ORB data for up to 20 previous sessions. When you scroll back in time, you will see the ORB levels for each historical session, drawn from the session start to the session end.
Historical ORBs are displayed with slightly faded colors, using 50 percent transparency compared to the current session. This creates a clear visual distinction between current and historical levels while still allowing you to analyze past price action relative to those levels.
The history depth is configurable. You can set it anywhere from 1 to 20 days depending on your needs. If you primarily care about the current session and the previous day for context, set it to 1 or 2. If you want to analyze an entire week or more of ORB behavior, increase the setting.
You can also disable the history feature entirely by enabling Current Session Only mode. This returns the indicator to showing only the active session, which some traders prefer for a cleaner chart during live trading.
Breakout Detection and Filters
The indicator marks breakouts with triangle signals. A green triangle below the bar indicates a bullish breakout above the ORB high. A red triangle above the bar indicates a bearish breakout below the ORB low.
However, not every crossing of an ORB level represents a valid breakout worth acting on. The indicator includes several filters to reduce false signals.
The Volume Filter requires that volume on the breakout bar be at least 1.2 times the 20-bar average volume. You can adjust this multiplier in the settings. The logic is straightforward: breakouts on weak volume are more likely to fail. A genuine breakout that is going to follow through should be accompanied by above-average participation.
The Time Filter prevents breakout signals after a specified hour. The default is 2:00 PM Eastern. The rationale is that late-session breakouts often lack follow-through because there is not enough trading time remaining for the move to develop. You can adjust or disable this filter based on your trading style.
The Single Trigger mechanism ensures that each breakout fires exactly once per session. If price crosses above the ORB high, you will see one bullish signal on the bar where the crossing occurred. If price subsequently pulls back and crosses above again, you will not see a second signal. This prevents signal spam and keeps your chart clean.
The indicator also includes Reclaim Detection. If price breaks out and then returns back inside the ORB zone, you will see a warning signal marked with an X. This condition often indicates a failed breakout and potential reversal. It is not a trade signal, but rather information that the breakout you just witnessed may not be valid.
Range Extensions
Once the ORB is established, many traders look for profit targets based on the range itself. The indicator includes extension levels that project multiples of the ORB range above and below the extremes.
By default, two extension levels are shown: 1.0 times the range and 1.5 times the range. If the 15-minute ORB is 50 points, the 1.0 extension above the high would be 50 points above the high, and the 1.5 extension would be 75 points above the high.
These extensions serve as potential profit targets for breakout trades. The 1.0 extension represents a measured move equal to the ORB itself. The 1.5 extension represents a slightly more ambitious target.
You can adjust the extension multipliers in the settings. Some traders prefer 0.5 and 1.0. Others prefer 1.0 and 2.0. The flexibility is there to match your trading approach.
The extension lines are displayed as faint dotted lines so they do not compete visually with the ORB levels themselves. The labels show the multiplier value along with the exact price.
## The Midline
The 50 percent level of the ORB, known as the midline, is displayed as a dashed line within the ORB zone. This level matters because it often acts as short-term support or resistance during consolidation periods within the range.
When price is trading inside the ORB and approaches the midline, you may see a reaction. The midline can also serve as a reference for whether price is showing strength or weakness within the range. If price is spending most of its time above the midline, that suggests a bullish bias even before a breakout occurs. If price is spending most of its time below the midline, that suggests a bearish bias.
The midline can be disabled in the settings if you prefer a cleaner chart.
The Dashboard
The dashboard is positioned in the top right corner of the chart and provides all relevant ORB information at a glance.
The header row displays the indicator name, the current Quality Score grade, the Range Classification, and the Session Status.
The Range Classification shows whether the current 15-minute ORB is Tight, Normal, or Wide compared to the 20-day average. This gives you immediate context about whether the range is unusual in either direction.
The Session Status shows whether the market is currently in session or closed. A green Live indicator means the session is active. A red Closed indicator means the session has ended.
Below the header, each timeframe row displays the following information:
The Timeframe column shows 15m, 30m, or 60m along with a visual indicator of the line style you have selected for that timeframe.
The High column displays the ORB high price for that timeframe.
The Low column displays the ORB low price for that timeframe.
The Range column displays the distance between high and low.
The Status column shows the current state. Before the ORB completes, this shows a countdown of minutes remaining. After completion, it shows whether the price has broken out bullish, broken out bearish, or remains in range.
Below the timeframe rows, the Distance row shows how far the current price is from the nearest ORB level. This helps you gauge whether price is approaching a potential breakout zone.
If confluence is detected, a highlighted row appears at the bottom of the dashboard indicating that significant level alignment exists.
Supported Markets and Sessions
The indicator supports multiple market types with appropriate session times:
US Stocks use a session from 9:30 AM to 4:00 PM Eastern.
US Futures use a session from 9:30 AM to 4:00 PM Eastern, with overnight tracking from 6:00 PM the previous evening.
Forex uses a 24-hour session since the market trades continuously.
Crypto uses a 24-hour session since the market trades continuously.
Custom allows you to define your own session times for markets not covered by the presets.
The timezone is configurable. The default is America/New_York, but you can change it to Chicago, Los Angeles, London, Tokyo, or UTC depending on your location and preference.
Settings Overview
The settings are organized into logical groups:
General settings include the market type, current session only toggle, and history days.
Session settings include custom session times and timezone selection.
ORB Timeframes settings include individual toggles for showing or hiding each timeframe, color selection, line width, and line style. This is where you customize the visual appearance of each ORB level.
Quality Scoring settings include the ATR period and range comparison lookback. These affect how the quality score is calculated.
Confluence Detection settings include the tolerance percentage and toggles for the session open and overnight high and low levels.
Breakout Settings include the volume filter toggle and multiplier, time filter toggle and cutoff hour, and reclaim detection toggle.
Visuals settings include toggles for the fill zone, labels, dashboard, distance display, and midline.
Extensions settings include toggles for showing extensions and the multiplier values for each extension level.
How I Use This Indicator
I will share my personal approach, though you should adapt it to your own style.
First, I wait for the ORB to complete. I do not trade during the first 15 to 30 minutes of the session. The levels are still forming, and the price action during this window is often erratic. I let the dust settle and the range establish itself.
Second, I check the Quality Score. If it is an A or A-plus day with a tight range and good volume, I am more aggressive. If it is a C day with a wide range on a Friday afternoon, I am either sitting on my hands or trading with reduced size.
Third, I look for confluence. If the 15-minute high is sitting right at the overnight high, that level has additional significance. Breakouts through confluence zones tend to be more decisive.
Fourth, I confirm with volume. Even though the indicator filters for volume, I still glance at the volume bars. I want to see that breakout candle have conviction.
Fifth, I manage expectations based on range type. If the ORB is tight, I expect an explosive move and give the trade room to develop. If the ORB is wide, I expect choppier action and tighten my parameters.
Sixth, I use the distance reading. If price is already 50 points beyond the ORB high and the range was only 40 points, I have missed the move. Chasing extended price is not smart trading.
Honest Pros and Cons
What this indicator does well:
It provides clean, accurate ORB levels that do not repaint. This is the foundation, and it is done correctly.
It offers multi-timeframe tracking with clear visual differentiation. You can see all three ORBs at once without confusion.
The quality scoring system helps you avoid low-probability setups. It is not perfect, but it adds valuable context.
The confluence detection highlights significant level alignment automatically. This saves you from manually checking multiple levels.
The smart label system prevents visual clutter. Labels combine when appropriate and remain readable.
The historical ORB display allows you to scroll back and review previous sessions. This is valuable for analysis and pattern recognition.
The customization is extensive. Every visual element can be adjusted to match your preferences.
It works across stocks, futures, forex, and crypto with appropriate session handling.
What this indicator does not do:
It does not give you buy and sell signals with entries and exits. This is a levels and analysis tool, not a trading system.
It does not include backtesting or performance tracking. You need a separate strategy tester for that.
It does not guarantee that breakouts will follow through. The filters help, but failed breakouts still occur.
The quality score is a guideline, not a prediction. Low-quality days can still produce good trades. High-quality days can still produce losing trades.
The confluence detection is proximity-based. It identifies when levels are near each other but does not know if those levels are actually significant to other traders.
Technical limitations to be aware of:
On chart timeframes larger than 15 minutes, the ORB calculation becomes less precise because you have fewer bars in the opening period. This indicator works best on 1 to 15 minute charts.
The overnight high and low tracking works best on futures. Stocks do not have true overnight sessions in the same way.
If your chart does not have volume data, the volume filter will not function properly.
Risk Management
This section is not about the indicator. It is about trading.
No indicator, no matter how well designed, can protect you from poor risk management. Before you trade any ORB breakout, you need to define your risk.
Where is your stop? A common approach is to place the stop on the opposite side of the ORB zone. If you are taking a bullish breakout above the high, your stop goes below the low. This means your risk is the full ORB range plus any slippage.
Is that risk acceptable? If the ORB range is 100 points and you are trading a 50 dollar per point contract, your risk is 5000 dollars plus commissions. Can you afford that loss? If not, either reduce your size or skip the trade.
Where is your target? The extensions provide potential targets, but you need to decide in advance where you will take profits. Hoping for an unlimited run while watching your profits evaporate is not a strategy.
What is your win rate? ORB breakouts do not work every time. Depending on the market and conditions, you might win 50 to 60 percent of the time. That means you will have losing trades. Are you prepared for a string of three or four losers in a row? It will happen.
None of this is specific to this indicator. It applies to all trading. But I include it here because I see too many traders focus on the indicator while ignoring the fundamentals of risk management. The indicator can help you identify setups. It cannot manage your risk for you.
Final Thoughts
I built this indicator for my own trading, then refined it to the point where I felt comfortable sharing it. It is not a holy grail. It will not make you profitable if you do not already have a trading process. What it will do is give you clean, accurate ORB levels with context that most indicators do not provide.
The Opening Range Breakout works because institutions and algorithms reference these same levels. When the first 30 or 60 minutes of trading establishes a range, that becomes a reference point for the rest of the session. This indicator makes those levels visible and adds intelligence around when they are worth paying attention to.
Use it as a tool, not a crutch. Combine it with your own analysis. Manage your risk properly. And please, do not trade with money you cannot afford to lose.
If you have questions or feedback, I am actively maintaining this indicator and will consider feature requests for future updates.
Trade well.
Tags
ORB, Opening Range Breakout, Intraday, Day Trading, Futures, Stocks, Multi-Timeframe, Breakout, Support Resistance, Session, NQ, ES, SPY, QQQ, Opening Range, Institutional Levels
Recommended Timeframes
This indicator works best on 1-minute, 2-minute, 3-minute, 5-minute, 10-minute, and 15-minute charts. It can be used on higher timeframes, but the ORB calculation becomes less precise.
Recommended Markets
US Stock Indices and Futures including ES, NQ, YM, RTY, SPY, QQQ, DIA, IWM. Individual stocks with sufficient liquidity. Forex major pairs. Cryptocurrency with defined trading sessions.
發行說明
Added the 5 min ORB for those that trade that time frame受保護腳本
此腳本以閉源形式發佈。 不過,您可以自由使用,沒有任何限制 — 點擊此處了解更多。
Risk Management > Everything else
免責聲明
這些資訊和出版物並非旨在提供,也不構成TradingView提供或認可的任何形式的財務、投資、交易或其他類型的建議或推薦。請閱讀使用條款以了解更多資訊。
免責聲明
這些資訊和出版物並非旨在提供,也不構成TradingView提供或認可的任何形式的財務、投資、交易或其他類型的建議或推薦。請閱讀使用條款以了解更多資訊。