OPEN-SOURCE SCRIPT
🧭 Harmonic Pressure Grid v1.0
Purpose:
The Harmonic Pressure Grid helps traders visually identify hidden pressure zones formed by harmonic swing ratios, filtered through RSI momentum and volume surges. These zones often act as powerful support or resistance levels, marking areas of potential price exhaustion or reversal.
🧩 Core Features:
✅ Automatic Swing Detection – Uses pivot highs/lows to map market structure
✅ Harmonic Ratio Matching – Highlights areas where price swings match common harmonic ratios (0.618, 1.0, 1.272, 1.618)
✅ RSI Slope Filter – Confirms upward or downward momentum during pressure formation
✅ Volume Spike Confluence – Validates the strength of pressure using abnormal volume
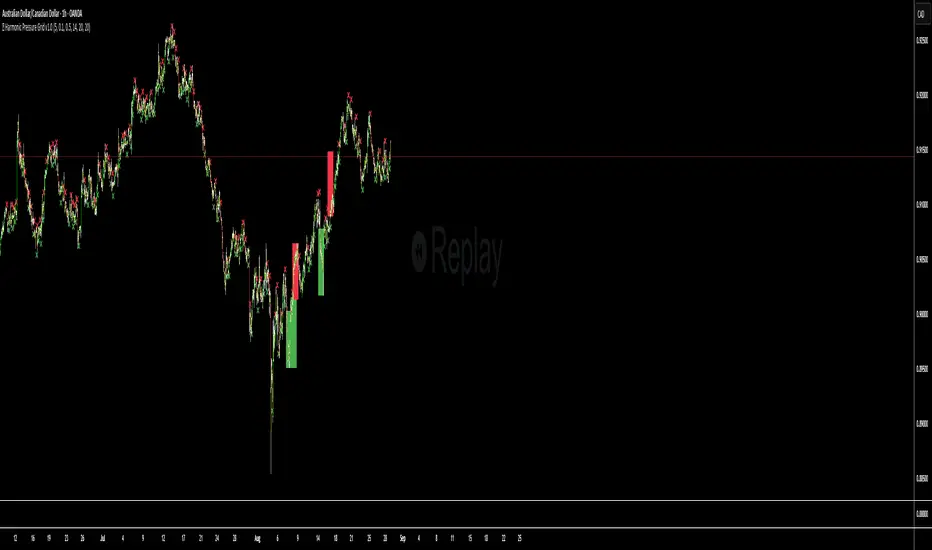
✅ Background Pressure Zones – Color intensity reflects confluence strength (green for potential support, red for resistance)
📈 How to Use:
Look for green or red background zones on the chart.
Green = Bullish pressure (potential support)
Red = Bearish pressure (potential resistance)
Zone strength is based on RSI direction + volume spike.
Stronger zones = more likely to influence price
Use zones for:
Entry timing: Watch for reversal behavior or confirmation candles inside zones
Exit planning: Use as target areas for partial or full take profit
Confluence stacking: Combine with trendlines, Fibonacci, or your own price action logic
🔍 Tips:
Works best in swing or positional setups, not scalping
Can be combined with other indicators for added confirmation
Use on any timeframe to reveal hidden structural pressure
Tweak swing length or ratio tolerance for more or fewer zones
The Harmonic Pressure Grid helps traders visually identify hidden pressure zones formed by harmonic swing ratios, filtered through RSI momentum and volume surges. These zones often act as powerful support or resistance levels, marking areas of potential price exhaustion or reversal.
🧩 Core Features:
✅ Automatic Swing Detection – Uses pivot highs/lows to map market structure
✅ Harmonic Ratio Matching – Highlights areas where price swings match common harmonic ratios (0.618, 1.0, 1.272, 1.618)
✅ RSI Slope Filter – Confirms upward or downward momentum during pressure formation
✅ Volume Spike Confluence – Validates the strength of pressure using abnormal volume
✅ Background Pressure Zones – Color intensity reflects confluence strength (green for potential support, red for resistance)
📈 How to Use:
Look for green or red background zones on the chart.
Green = Bullish pressure (potential support)
Red = Bearish pressure (potential resistance)
Zone strength is based on RSI direction + volume spike.
Stronger zones = more likely to influence price
Use zones for:
Entry timing: Watch for reversal behavior or confirmation candles inside zones
Exit planning: Use as target areas for partial or full take profit
Confluence stacking: Combine with trendlines, Fibonacci, or your own price action logic
🔍 Tips:
Works best in swing or positional setups, not scalping
Can be combined with other indicators for added confirmation
Use on any timeframe to reveal hidden structural pressure
Tweak swing length or ratio tolerance for more or fewer zones
開源腳本
本著TradingView的真正精神,此腳本的創建者將其開源,以便交易者可以查看和驗證其功能。向作者致敬!雖然您可以免費使用它,但請記住,重新發佈程式碼必須遵守我們的網站規則。
免責聲明
這些資訊和出版物並不意味著也不構成TradingView提供或認可的金融、投資、交易或其他類型的意見或建議。請在使用條款閱讀更多資訊。
開源腳本
本著TradingView的真正精神,此腳本的創建者將其開源,以便交易者可以查看和驗證其功能。向作者致敬!雖然您可以免費使用它,但請記住,重新發佈程式碼必須遵守我們的網站規則。
免責聲明
這些資訊和出版物並不意味著也不構成TradingView提供或認可的金融、投資、交易或其他類型的意見或建議。請在使用條款閱讀更多資訊。