OPEN-SOURCE SCRIPT
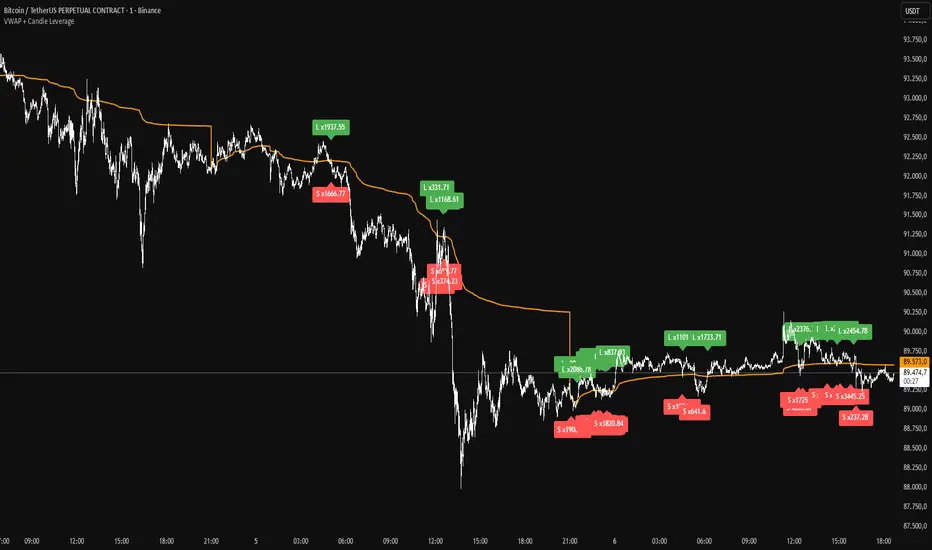
VWAP + Candle Leverage
What if you could extract more value from each trade based on your stop loss and entry, increasing your leverage safely? Could your winning trades be even more profitable?
This indicator uses the VWAP (Volume Weighted Average Price) to calculate safe leverage per candle, allowing traders to maximize each trade within a defined stop loss. Actual profit remains variable depending on market movement and applied leverage.
How signals appear and how leverage is determined
L (green): signals that price crossed above the VWAP (potential long entry).
S (red): signals that price crossed below the VWAP (potential short entry).
Each crossover shows a label with “x”, indicating the theoretical safe leverage for that candle.
How safe leverage is calculated:
Long: close ÷ (close − candle low)
Short: close ÷ (candle high − close)
How leverage is applied:
Identify the signal candle and record close, high, and low.
Calculate the difference between the close price and the stop price (low for Long, high for Short).
The percentage difference between these prices is our safe leverage: the smaller the difference, the higher the leverage possible, always respecting the stop loss.
The “x” label shows this maximum leverage, protecting the position balance using the candle’s stop loss.
Actual profit will still depend on market movement, but the stop loss is already defined and secure.
Main benefits:
Maximize trade potential with known stop loss
Plan entries and position sizing safely
Clearly visualize safe leverage per candle
Simple, efficient, and educational
Disclaimer:
The indicator does not execute trades automatically and is not a full trading system. It is intended solely for educational purposes and safe leverage management.
開源腳本
秉持TradingView一貫精神,這個腳本的創作者將其設為開源,以便交易者檢視並驗證其功能。向作者致敬!您可以免費使用此腳本,但請注意,重新發佈代碼需遵守我們的社群規範。
免責聲明
這些資訊和出版物並非旨在提供,也不構成TradingView提供或認可的任何形式的財務、投資、交易或其他類型的建議或推薦。請閱讀使用條款以了解更多資訊。
開源腳本
秉持TradingView一貫精神,這個腳本的創作者將其設為開源,以便交易者檢視並驗證其功能。向作者致敬!您可以免費使用此腳本,但請注意,重新發佈代碼需遵守我們的社群規範。
免責聲明
這些資訊和出版物並非旨在提供,也不構成TradingView提供或認可的任何形式的財務、投資、交易或其他類型的建議或推薦。請閱讀使用條款以了解更多資訊。