HMA Buy Sell Signals - Profit ManagerNote : Settings should be adjusted according to the selected time frame. Try to find the best setting according to the profitability rate
Overall Functionality
This script combines several trading tools to create a comprehensive system for trend analysis, trade execution, and performance tracking. Users can identify market trends using specific moving averages and RSI indicators while managing profit and loss levels automatically.
Trend Detection and Trade Signals
Hull Moving Averages (HMA):
Two HMAs (a faster one and a slower one) are used to determine the market trend.
A buy signal is generated when the faster HMA crosses above the slower HMA.
Conversely, a sell signal is triggered when the faster HMA crosses below the slower one.
Visual Feedback:
Trend lines on the chart change color to reflect the trend direction (e.g., green for upward trends and red for downward trends).
Trade Levels and Management
Entry, Take-Profit, and Stop-Loss Levels:
When the trend shifts upwards, the script calculates entry, take-profit, and stop-loss levels based on the opening price.
Similarly, for downward trends, these levels are determined for short trades.
Commission Tracking:
Each trade includes a commission cost, which is factored into net profit and loss calculations.
Dynamic Labels:
Entry, take-profit, and stop-loss levels are visually marked on the chart for easier tracking.
Performance Tracking
Profit and Loss Tracking:
The script keeps a running total of profits, losses, and commissions for both long and short trades.
It also calculates the net profit after all costs are considered.
Performance Table:
A table is displayed on the chart summarizing:
The number of trades.
Total profit and loss for long and short positions.
Commission costs.
Net profit.
Fractal Support and Resistance
Dynamic Lines:
The script identifies the most recent significant highs and lows using fractals.
It draws support and resistance lines that automatically update as new fractals form.
Simplified Visuals:
The chart always shows the last two support and resistance lines, keeping the visualization clean and focused.
RSI-Based Signals
Overbought and Oversold Levels:
RSI is used to identify overbought (above 80) and oversold (below 20) conditions.
The script generates buy signals at oversold levels and sell signals at overbought levels.
Chart Indicators:
Arrows and labels appear on the chart to highlight these RSI-based opportunities.
Customization
The script allows users to customize key parameters such as:
Moving average lengths for trend detection.
Take-profit and stop-loss percentages.
Timeframes for backtesting.
Starting capital and commission rates.
Conclusion
This script is a versatile tool for traders, combining trend detection, automated trade management, and visual feedback. It simplifies decision-making by providing clear signals and tracking performance metrics, making it suitable for both beginners and experienced traders.
* The most recently drawn fractals represent potential support and resistance levels. If the price aligns with these levels at the time of entering a trade, it may indicate a likelihood of reversal. In such cases, it’s advisable to either avoid entering the trade altogether or proceed with increased caution.
在腳本中搜尋"stop loss"

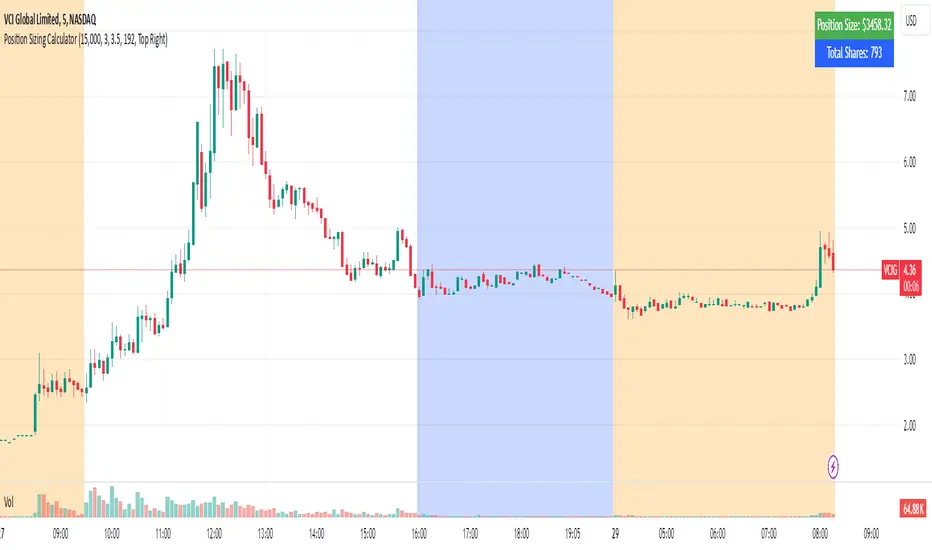
Position Sizing Calculator (Real-Time)█ SUMMARY
The following indicator is a Position Sizing Calculator based on Average True Range (ATR), originally developed by market technician J. Welles Wilder Jr., intended for real-time trading.
This script utilizes the user's account size, acceptable risk percentage, and a stop-loss distance based on ATR to dynamically calculate the appropriate position size for each trade in real time.
█ BACKGROUND
Developed for use on the 5-minute timeframe, this script provides traders with continuously updated, dynamic position sizes. It enables traders to instantly determine the exact number of shares and dollar amount to use for entering a trade within their acceptable risk tolerance whenever a trade opportunity arises.
This real-time position sizing tool helps traders make well-informed decisions when planning trade entries and calculating maximum stop-loss levels, ultimately enhancing risk management.
█ USER INPUTS
Trading Account Size: Total dollar value of the user's trading account.
Acceptable Risk (%): Maximum percentage of the trading account that the user is willing to risk per trade.
ATR Multiplier for Stop-Loss: Multiplier used to determine the distance of the stop-loss from the current price, based on the ATR value.
ATR Length: The length of the lookback period used to calculate the ATR value.
ATT Model with Buy/Sell SignalsIndicator Summary
This indicator is based on the ATT (Arithmetic Time Theory) model, using specific turning points derived from the ATT sequence (3, 11, 17, 29, 41, 47, 53, 59) to identify potential market reversals. It also integrates the RSI (Relative Strength Index) to confirm overbought and oversold conditions, triggering buy and sell signals when conditions align with the ATT sequence and RSI level.
Turning Points: Detected based on the ATT sequence applied to bar count. This suggests high-probability areas where the market could turn.
RSI Filter: Adds strength to the signals by ensuring buy signals occur when RSI is oversold (<30) and sell signals when RSI is overbought (>70).
Max Signals Per Session: Limits signals to two per session to reduce over-trading.
Entry Criteria
Buy Signal: Enter a buy trade if:
The indicator displays a green "BUY" marker.
RSI is below the oversold level (default <30), suggesting a potential upward reversal.
Sell Signal: Enter a sell trade if:
The indicator displays a red "SELL" marker.
RSI is above the overbought level (default >70), indicating a potential downward reversal.
Exit Criteria
Take Profit (TP):
Define TP as a fixed percentage or point value based on the asset's volatility. For example, set TP at 1.5-2x the risk, or a predefined point target (like 50-100 points).
Alternatively, exit the position when price approaches a key support/resistance level or the next significant swing high/low.
Stop Loss (SL):
Place the SL below the recent low (for buys) or above the recent high (for sells).
Set a fixed SL in points or percentage based on the asset’s average movement range, like an ATR-based stop, or limit it to a specific risk amount per trade (1-2% of account).
Trailing into Profit
Use a trailing strategy to lock in profits and let winning trades run further. Two main options:
ATR Trailing Stop:
Set the trailing stop based on the ATR (Average True Range), adjusting every time a new candle closes. This can help in volatile markets by keeping the stop at a consistent distance based on recent price movement.
Break-Even and Partial Profits:
When the price moves in your favor by a set amount (e.g., 1:1 risk/reward), move SL to the entry (break-even).
Take partial profit at intermediate levels (e.g., 50% at 1:1 RR) and trail the remainder.
Risk Management for Prop Firm Evaluation
Prop firms often have strict rules on daily loss limits, max drawdowns, and minimum profit targets. Here’s how to align your strategy with these:
Limit Risk per Trade:
Keep risk per trade to a conservative level (e.g., 1% or lower of your account balance). This allows for more room in case of a drawdown and aligns with most prop firm requirements.
Daily Loss Limits:
Set a daily stop-loss that ensures you don’t exceed the firm’s rules. For example, if the daily limit is 5%, stop trading once you reach a 3-4% drawdown.
Avoid Over-Trading:
Stick to the max signals per session rule (one or two trades). Taking only high-probability setups reduces emotional and reactive trades, preserving capital.
Stick to a Profit Target:
Aim to meet the evaluation’s profit goal efficiently but avoid risky or oversized trades to reach it faster.
Avoid Major Economic Events:
News events can disrupt technical setups. Avoid trading around significant releases (like FOMC or NFP) to reduce the chance of sudden losses due to high volatility.
Summary
Using this strategy with discipline, a structured entry/exit approach, and tight risk management can maximize your chances of passing a prop firm evaluation. The ATT model’s turning points, combined with the RSI, provide an edge by highlighting reversal zones, while limiting trades to 1-2 per session helps maintain controlled risk.

Dynamic Trading Strategy with Key Levels, Entry/Exit ManagementThis indicator provides a complete rule-based trading system, combining key levels, entry conditions, stop loss (SL), and take profit (TP) management. It’s designed to dynamically adapt to market conditions by identifying crucial support and resistance zones, determining entry points based on price action and volume, and calculating risk-based exit targets.
Key Features
Key Level Identification:
The indicator automatically identifies support and resistance levels based on recent price highs and lows within a customizable lookback period.
It adds a dynamic buffer around these levels using the Average True Range (ATR) to account for market volatility, ensuring the zones adjust to changing conditions.
Entry Conditions:
Bullish Entry: Triggers near the support zone when there’s upward price action, confirmed by volume spikes and bullish candlestick patterns (e.g., hammers, engulfing candles).
Bearish Entry: Triggers near the resistance zone when signs of rejection appear, confirmed by volume spikes and bearish candlestick patterns (e.g., shooting stars, bearish engulfing).
Entry zones are highlighted visually on the chart using green (bullish) and red (bearish) shaded boxes.
Stop Loss (SL) and Take Profit (TP):
Stop Loss: Calculated based on ATR multipliers, allowing you to set a volatility-adjusted risk level beyond the entry range.
Take Profit: Includes two profit-taking levels (TP1 and TP2), allowing for partial position exits. TP levels are calculated based on a reward-to-risk ratio, ensuring consistent profitability targets.
SL and TP levels are clearly marked with horizontal lines and labeled as SL, TP1, and TP2, helping you manage trade exits effectively.
Market Context Adaptability:
The indicator adapts to both trending and ranging market conditions. In trending markets, it favors trades that follow the trend, while in ranging markets, it focuses on reversals within the range boundaries.
Visual Aids:
Entry zones are highlighted with shaded boxes to indicate potential buy/sell regions.
SL, TP1, and TP2 levels are clearly drawn with labels, allowing for easy identification of exit points.
How to Use
Identify Key Levels: Look for support and resistance zones highlighted by the indicator on your chart.
Wait for Entry Conditions: When the price enters the entry range (marked by green or red boxes), wait for confirmation signals—such as volume spikes and candlestick patterns.
Manage Exits: Use the SL, TP1, and TP2 levels for structured trade management. Consider scaling out partially at TP1 and exiting fully at TP2.
Ideal For:
This indicator is suitable for traders who prefer a systematic approach to trading, with clear entry and exit rules. It is particularly helpful for those looking to balance risk and reward with well-defined take profit and stop loss levels.

Stoch RSI and RSI Buy/Sell Signals with MACD Trend FilterDescription of the Indicator
This Pine Script is designed to provide traders with buy and sell signals based on the combination of Stochastic RSI, RSI, and MACD indicators, enhanced by the confirmation of candle colors. The primary goal is to facilitate informed trading decisions in various market conditions by utilizing different indicators and their interactions. The script allows customization of various parameters, providing flexibility for traders to adapt it to their specific trading styles.
Usefulness
This indicator is not just a mashup of existing indicators; it integrates the functionality of multiple momentum and trend-detection methods into a cohesive trading tool. The combination of Stochastic RSI, RSI, and MACD offers a well-rounded approach to analyzing market conditions, allowing traders to identify entry and exit points effectively. The inclusion of color-coded signals (strong vs. weak) further enhances its utility by providing visual cues about the strength of the signals.
How to Use This Indicator
Input Settings: Adjust the parameters for the Stochastic RSI, RSI, and MACD to fit your trading style. Set the overbought/oversold levels according to your risk tolerance.
Signal Colors:
Strong Buy Signal: Indicated by a green label and confirmed by a green candle (close > open).
Weak Buy Signal: Indicated by a blue label and confirmed by a green candle (close > open).
Strong Sell Signal: Indicated by a red label and confirmed by a red candle (close < open).
Weak Sell Signal: Indicated by an orange label and confirmed by a red candle (close < open).
Example Trading Strategy Using This Indicator
To effectively use this indicator as part of your trading strategy, follow these detailed steps:
Setup:
Timeframe : Select a timeframe that aligns with your trading style (e.g., 15-minute for intraday, 1-hour for swing trading, or daily for longer-term positions).
Indicator Settings : Customize the Stochastic RSI, RSI, and MACD parameters to suit your trading approach. Adjust overbought/oversold levels to match your risk tolerance.
Strategy:
1. Strong Buy Entry Criteria :
Wait for a strong buy signal (green label) when the RSI is at or below the oversold level (e.g., ≤ 35), indicating a deeply oversold market. Confirm that the MACD shows a decreasing trend (bearish momentum weakening) to validate a potential reversal. Ensure the current candle is green (close > open) if candle color confirmation is enabled.
Example Use : On a 1-hour chart, if the RSI drops below 35, MACD shows three consecutive bars of decreasing negative momentum, and a green candle forms, enter a buy position. This setup signals a robust entry with strong momentum backing it.
2. Weak Buy Entry Criteria :
Monitor for weak buy signals (blue label) when RSI is above the oversold level but still below the neutral (e.g., between 36 and 50). This indicates a market recovering from an oversold state but not fully reversing yet. These signals can be used for early entries with additional confirmations, such as support levels or higher timeframe trends.
Example Use : On the same 1-hour chart, if RSI is at 45, the MACD shows momentum stabilizing (not necessarily negative), and a green candle appears, consider a partial or cautious entry. Use this as an early warning for a potential bullish move, especially when higher timeframe indicators align.
3. Strong Sell Entry Criteria :
Look for a strong sell signal (red label) when RSI is at or above the overbought level (e.g., ≥ 65), signaling a strong overbought condition. The MACD should show three consecutive bars of increasing positive momentum to indicate that the bullish trend is weakening. Ensure the current candle is red (close < open) if candle color confirmation is enabled.
Example Use : If RSI reaches 70, MACD shows increasing momentum that starts to level off, and a red candle forms on a 1-hour chart, initiate a short position with a stop loss set above recent resistance. This is a high-confidence signal for potential price reversal or pullback.
4. Weak Sell Entry Criteria :
Use weak sell signals (orange label) when RSI is between the neutral and overbought levels (e.g., between 50 and 64). These can indicate potential short opportunities that might not yet be fully mature but are worth monitoring. Look for other confirmations like resistance levels or trendline touches to strengthen the signal.
Example Use : If RSI reads 60 on a 1-hour chart, and the MACD shows slight positive momentum with signs of slowing down, place a cautious sell position or scale out of existing long positions. This setup allows you to prepare for a possible downtrend.
Trade Management:
Stop Loss : For buy trades, place stop losses below recent swing lows. For sell trades, set stops above recent swing highs to manage risk effectively.
Take Profit : Target nearby resistance or support levels, apply risk-to-reward ratios (e.g., 1:2), or use trailing stops to lock in profits as price moves in your favor.
Confirmation : Align these signals with broader trends on higher timeframes. For example, if you receive a weak buy signal on a 15-minute chart, check the 1-hour or daily chart to ensure the overall trend is not bearish.
Real-World Example: Imagine trading on a 15-minute chart :
For a buy:
A strong buy signal (green) appears when the RSI dips to 32, MACD shows declining bearish momentum, and a green candle forms. Enter a buy position with a stop loss below the most recent support level.
Alternatively, a weak buy signal (blue) appears when RSI is at 47. Use this as a signal to start monitoring the market closely or enter a smaller position if other indicators (like support and volume analysis) align.
For a sell:
A strong sell signal (red) with RSI at 72 and a red candle signals to short with conviction. Place your stop loss just above the last peak.
A weak sell signal (orange) with RSI at 62 might prompt caution but can still be acted on if confirmed by declining volume or touching a resistance level.
These strategies show how to blend both strong and weak signals into your trading for more nuanced decision-making.
Technical Analysis of the Code
1. Stochastic RSI Calculation:
The script calculates the Stochastic RSI (stochRsiK) using the RSI as input and smooths it with a moving average (stochRsiD).
Code Explanation : ta.stoch(rsi, rsi, rsi, stochLength) computes the Stochastic RSI, and ta.sma(stochRsiK, stochSmoothing) applies smoothing.
2. RSI Calculation :
The RSI is computed over a user-defined period and checks for overbought or oversold conditions.
Code Explanation : rsi = ta.rsi(close, rsiLength) calculates RSI values.
3. MACD Trend Filter :
MACD is calculated with fast, slow, and signal lengths, identifying trends via three consecutive bars moving in the same direction.
Code Explanation : = ta.macd(close, macdLengthFast, macdLengthSlow, macdSignalLength) sets MACD values. Conditions like macdLine < macdLine confirm trends.
4. Buy and Sell Conditions :
The script checks Stochastic RSI, RSI, and MACD values to set buy/sell flags. Candle color filters further confirm valid entries.
Code Explanation : buyConditionMet and sellConditionMet logically check all conditions and toggles (enableStochCondition, enableRSICondition, etc.).
5. Signal Flags and Confirmation :
Flags track when conditions are met and ensure signals only appear on appropriate candle colors.
Code Explanation : Conditional blocks (if statements) update buyFlag and sellFlag.
6. Labels and Alerts :
The indicator plots "BUY" or "SELL" labels with the RSI value when signals trigger and sets alerts through alertcondition().
Code Explanation : label.new() displays the signal, color-coded for strength based on RSI.
NOTE : All strategies can be enabled or disabled in the settings, allowing traders to customize the indicator to their preferences and trading styles.

Trade Manager 2Hi Traders,
this manager will make it easier for you to enter lots into your trading platform. Just go to the indicator settings, set your trading account amount, RRR, % risk and then give ok. If you then know where you want to put the stop loss then reopen, enter the value and hit ok again. The chart will show you exactly the stop loss and take profit as you wanted. The stop loss will always stay where you enter it and the take profit will move with the lot size as the price goes further or closer to the stop loss.
This should help when entering the number of lots, TP, SL into the platform.

The Exact IndicatorStruggling to get in on a trade? Don't know where to take profits? This indicator might help - it only displays the Buy, Stop Loss and Take profit points when certain conditions are met.
The indicator combines a moving average crossover strategy with trend analysis to identify potential buy opportunities in the market. It utilises a short-term and long-term Simple Moving Average (SMA) to generate buy signals when the short-term SMA crosses above the long-term SMA. Additionally, it displays take profit and stop loss levels, along with a background colour indicating the overall trend strength.
Pros :
Clear Signals : Provides straightforward buy signals based on a well-known crossover strategy, making it easy for traders to identify entry points.
Visual Aids : The inclusion of take profit and stop loss levels, along with background trend colors, enhances decision-making and risk management.
Trend Awareness : The background colour changes based on trend strength, allowing traders to quickly assess market conditions.
Cons :
Lagging Indicator : Moving averages are inherently lagging, which can result in delayed signals, especially in volatile markets.
False Signals : Crossover strategies can produce false signals during sideways or choppy market conditions, leading to potential losses.
Limited Scope : The indicator focuses primarily on buy signals, potentially missing out on other trading opportunities (like short-selling) in a bearish market.
Overall, while this indicator can be a useful tool for identifying bullish trends and potential entry points, traders should use it in conjunction with other analysis methods and risk management strategies to mitigate its limitations.

ATR+StdTR Band and Trailing StopThis Pine Script code plots the "ATR+StdTR Band and Trailing Stop," serving as a tool for volatility-based risk management and trend detection. While bands are typically set using a multiple of ATR, this script uses StdTR (the True Range standard deviation) and sets the band width based on ±(ATR + n times StdTR). StdTR is a great tool for detecting price volatility and anomalies, allowing traders to adapt to rapid changes in extreme market conditions. This helps traders proactively manage risk during sudden market fluctuations.
The following features are provided:
Table Display
A table is shown on the chart, allowing traders to visually track the current ATR value, StdTR (σ), and the long/short stop-loss levels (±ATR ± nσ). This enables real-time monitoring of risk management data.
Band Plots
The script plots bands that combine ATR with StdTR (nσ).
The upper and lower bands are calculated using the previous candle’s closing price (the source is customizable) and are plotted as ±(ATR + nσ), providing a clear visual of the price range.
ATR ± nσ Trailing Stop
The trailing stop dynamically adjusts the stop-loss levels based on price movements. In an uptrend, the stop-loss rises, while in a downtrend, it lowers, helping traders lock in profits while minimizing losses during significant reversals.
Breakout Detection
Breakouts are detected when the price exceeds the upper band or drops below the lower band. A visual marker (X) is displayed on the chart, allowing traders to quickly recognize when the price has moved beyond normal volatility ranges, making it easier to respond to trend formations or reversals.
Customization Points:
The ATR period and StdTR (n) are fully customizable.
The source for ATR band calculation can be adjusted, allowing traders to choose from close, open, high, low, etc.
The table’s display position and design (text color, size, etc.) can be customized to present the information clearly and effectively.

Descriptive Backtesting Framework (DBF)As the name suggests, this is a backtesting framework made to offer full backtesting functionality to any custom indicator in a visually descriptive way.
Any trade taken will be very clear to visualize on the chart and the equity line will be updated live allowing us to use the REPLAY feature to view the strategy performing in real time.
Stops and Targets will also get draw on the chart with labels and tooltips and there will be a table on the top right corner displaying lots of descriptive metrics to measure your strategy's performance.
IF YOU DECIDE TO USE THIS FRAMEWORK, PLEASE READ **EVERYTHING** BELOW
HOW TO USE IT
Step 1 - Insert Your Strategy Indicators:
Inside this framework's code, right at the beginning, you will find a dedicated section where you can manually insert any set of indicators you desire.
Just replace the example code in there with your own strategy indicators.
Step 2 - Specify The Conditions To Take Trades:
After that, there will be another section where you need to specify your strategy's conditions to enter and exit trades.
When met, those conditions will fire the trading signals to the trading engine inside the framework.
If you don't wish to use some of the available signals, please just assign false to the signal.
DO NOT DELETE THE SIGNAL VARIABLES
Step 3 - Specify Entry/Exit Prices, Stops & Targets:
Finally you'll reach the last section where you'll be able to specify entry/exit prices as well as add stops and targets.
On most cases, it's easier and more reliable to just use the close price to enter and exit trades.
If you decide to use the open price instead, please remember to change step 2 so that trades are taken on the open price of the next candle and not the present one to avoid the look ahead bias.
Stops and targets can be set in any way you want.
Also, please don't forget to update the spread. If your broker uses commissions instead of spreads or a combination of both, you'll need to manually incorporate those costs in this step.
And that's it! That's all you have to do.
Below this section you'll now see a sign warning you about not making any changes to the code below.
From here on, the framework will take care of executing the trades and calculating the performance metrics for you and making sure all calculations are consistent.
VISUAL FEATURES:
Price candles get painted according to the current trade.
They will be blue during long trades, purple on shorts and white when no trade is on.
When the framework receives the signals to start or close a trade, it will display those signals as shapes on the upper and lower limits of the chart:
DIAMOND: represents a signal to open a trade, the trade direction is represented by the shape's color;
CROSS: means a stop loss was triggered;
FLAG: means a take profit was triggered;
CIRCLE: means an exit trade signal was fired;
Hovering the mouse over the trade labels will reveal:
Asset Quantity;
Entry/Exit Prices;
Stops & Targets;
Trade Profit;
Profit As Percentage Of Trade Volume;
**Please note that there's a limit as to how many labels can be drawn on the chart at once.**
If you which to see labels from the beginning of the chart, you'll probably need to use the replay feature.
PERFORMANCE TABLE:
The performance table displays several performance metrics to evaluate the strategy.
All the performance metrics here are calculated by the framework. It does not uses the oficial pine script strategy tester.
All metrics are calculated in real time. If using the replay feature, they will be updated up to the last played bar.
Here are the available metrics and their definition:
INITIAL EQUITY: the initial amount of money we had when the strategy started, obviously...;
CURRENT EQUITY: the amount of money we have now. If using the replay feature, it will show the current equity up to the last bar played. The number on it's right side shows how many times our equity has been multiplied from it's initial value;
TRADE COUNT: how many trades were taken;
WIN COUNT: how many of those trades were wins. The percentage at the right side is the strategy WIN RATE;
AVG GAIN PER TRADE: the average percentage gain per trade. Very small values can indicate a fragile strategy that can behave in unexpected ways under high volatility conditions;
AVG GAIN PER WIN: the average percentage gain of trades that were profitable;
AVG GAIN PER LOSS: the average percentage loss on trades that were not profitable;
EQUITY MAX DD: the maximum drawdown experienced by our equity during the entire strategy backtest;
TRADE MAX DD: the maximum drawdown experienced by our equity after one single trade;
AVG MONTHLY RETURN: the compound monthly return that our strategy was able to create during the backtested period;
AVG ANNUAL RETURN: this is the strategy's CAGR (compound annual growth rate);
ELAPSED MONTHS: number of months since the backtest started;
RISK/REWARD RATIO: shows how profitable the strategy is for the amount of risk it takes. Values above 1 are very good (and rare). This is calculated as follows: (Avg Annual Return) / mod(Equity Max DD). Where mod() is the same as math.abs();
AVAILABLE SETTINGS:
SPREAD: specify your broker's asset spread
ENABLE LONGS / SHORTS: you can keep both enable or chose to take trades in only one direction
MINIMUM BARS CLOSED: to avoid trading before indicators such as a slow moving average have had time to populate, you can manually set the number of bars to wait before allowing trades.
INITIAL EQUITY: you can specify your starting equity
EXPOSURE: is the percentage of equity you wish to risk per trade. When using stops, the strategy will automatically calculate your position size to match the exposure with the stop distance. If you are not using stops then your trade volume will be the percentage of equity specified here. 100 means you'll enter trades with all your equity and 200 means you'll use a 2x leverage.
MAX LEVERAGE ALLOWED: In some situations a short stop distance can create huge levels of leverage. If you want to limit leverage to a maximum value you can set it here.
SEVERAL PLOTTING OPTIONS: You'll be able to specify which of the framework visuals you wish to see drawn on the chart.
FRAMEWORK **LIMITATIONS**:
When stop and target are both triggered in the same candle, this framework isn't able to enter faster timeframes to check which one was triggered first, so it will take the pessimistic assumption and annul the take profit signal;
This framework doesn't support pyramiding;
This framework doesn't support both long and short positions to be active at the same time. So for example, if a short signal is received while a long trade is open, the framework will close the long trade and then open a short trade;
FINAL CONSIDERATIONS:
I've been using this framework for a good time and I find it's better to use and easier to analyze a strategy's performance then relying on the oficial pine script strategy tester. However, I CANNOT GUARANTEE IT TO BE BUG FREE.
**PLEASE PERFORM A MANUAL BACKTEST BEFORE USING ANY STRATEGY WITH REAL MONEY**

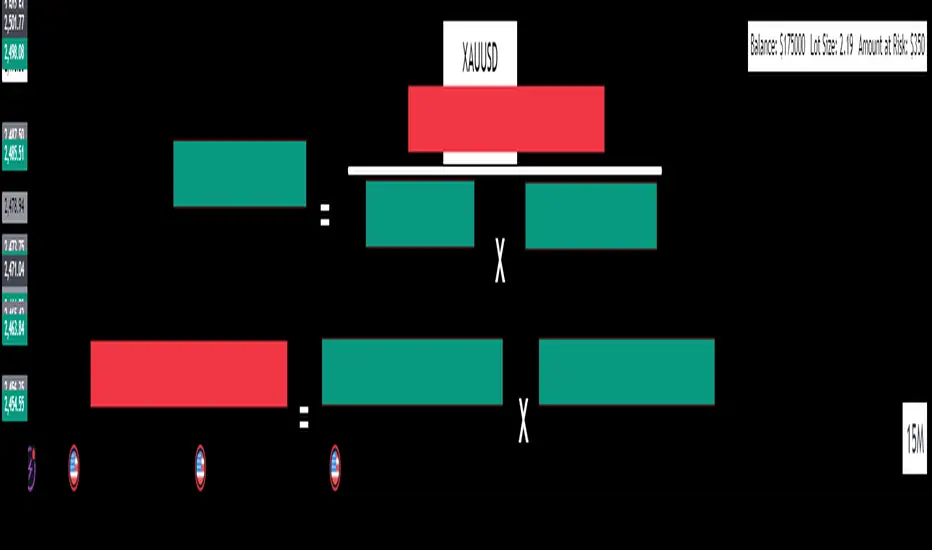
Lot Size Calculator by MenolakRugiThe Lot Size Formula in forex trading is a critical tool that offers several key benefits to traders:
🟢Risk Management: By using the formula, traders can control the amount of capital they risk on each trade. This helps prevent excessive losses by aligning the lot size with a predefined risk tolerance, such as 1% or 2% of the account balance.
🟢Consistent Position Sizing: The formula ensures that position sizes are calculated based on the specific trade setup, including the distance to the stop loss. This consistency helps avoid over-leveraging and reduces the emotional aspect of trading.
🟢Adaptability: The lot size can be adjusted according to different currency pairs and market conditions. This flexibility ensures that traders can apply the formula across various trading instruments and environments.
🟢Improved Profit Potential: By managing risk effectively, traders can protect their capital while maximizing profit opportunities. When losses are controlled, traders are able to stay in the market longer and compound their gains over time.
🟢Precision in Trade Planning: Calculating the lot size allows traders to plan their trades more precisely, aligning their strategies with the amount they are willing to risk. This leads to more disciplined and structured trading, reducing impulsive decisions.
In summary, the lot size formula helps maintain a balanced approach to trading, where both risk and reward are carefully managed to increase the chances of long-term success.
False Breakouts [TradingFinder] Fake Breakouts Failure🔵 Introduction
Technical indicators are essential tools for analysts and traders in financial markets, helping them predict price movements and make better trading decisions. One of the key concepts in technical analysis that should be carefully considered is the "False Breakout."
This phenomenon occurs when a price temporarily breaks through a significant support or resistance level but fails to hold and quickly returns to its previous range. Understanding this concept and applying it in trading can reduce risks and increase profitability.
🟣 What is a False Breakout?
A Fake Breakout, as the name suggests, refers to a breakout that appears to occur but fails to sustain, leading the price to quickly revert back to its previous range. This situation often happens when inexperienced or non-professional traders, under psychological pressure and eager to enter the market quickly, initiate trades.
This creates opportunities for professional traders to take advantage of these short-term fluctuations and execute successful trades.
🟣 The Importance of Recognizing False Breakouts
Recognizing False Breakouts is crucial for any trader aiming for success in financial markets. False Breakouts typically occur when the market approaches a critical support or resistance level.
In these situations, many traders are waiting to see if the price will break through this level. However, when the price quickly returns to its previous range, it indicates weakness in the movement and the inability to sustain the breakout.
🟣 How to identify False Breakouts?
To identify Fake Breakouts, it is important to carefully analyze price charts and look for signs of a quick price reversal after breaking a key level.
Here are some chart patterns that may help you identify a False Breakout :
1. Pin Bar Pattern : The Pin Bar is a candlestick pattern that indicates a price reversal. This pattern usually appears near support and resistance levels, showing that the price attempted to break through a key level but failed and reversed.
2. Fakey Pattern : This pattern, which consists of several candlesticks, indicates a False Breakout and a quick price return to the previous range. It usually appears near key levels and can signal a trend reversal.
3. Using Multiple Timeframes : One way to identify False Breakouts is by using charts of different timeframes. Sometimes, a breakout on a one-hour chart may be a False Breakout on a daily chart. Analyzing charts across multiple timeframes can help you accurately identify this phenomenon.
🔵 How to Use
Once you identify a False Breakout, you can use it as a trading signal. For this, it is best to look for trading opportunities in the opposite direction of the False Breakout. In other words, if a False Breakout occurs at a resistance level, you might consider selling opportunities, and if it happens at a support level, you might look for buying opportunities.
Here are some key points for trading based on False Breakouts :
1. Patience and Discipline : Patience and discipline are crucial when trading with False Breakouts. Wait for the False Breakout to clearly form before entering a trade.
2. Use Stop Loss : Setting an appropriate stop loss is vital when trading based on False Breakouts. Typically, the stop loss can be placed near the level where the False Breakout occurred.
3. Seek Confirmations : Before entering a trade, look for additional confirmations. These can include other analyses or technical indicators that show the price is likely to return to its previous level.
🔵 Settings
🟣 Logical settings
Swing period : You can set the swing detection period.
Max Swing Back Method : It is in two modes "All" and "Custom". If it is in "All" mode, it will check all swings, and if it is in "Custom" mode, it will check the swings to the extent you determine.
Max Swing Bac k: You can set the number of swings that will go back for checking.
🟣 Display settings
Displaying or not displaying swings and setting the color of labels and lines.
🟣 Alert Settings
Alert False Breakout : Enables alerts for Breakout.
Message Frequency : Determines the frequency of alerts. Options include 'All' (every function call), 'Once Per Bar' (first call within the bar), and 'Once Per Bar Close' (final script execution of the real-time bar). Default is 'Once per Bar'.
Show Alert Time by Time Zone : Configures the time zone for alert messages. Default is 'UTC'.
🔵Conclusion
False Breakouts, as a key concept in technical analysis, are powerful tools for identifying sudden price changes and using them in trading. Understanding this phenomenon and applying it can help traders perform better in financial markets and avoid potential losses.
To benefit from False Breakouts, traders need to carefully analyze charts and use the appropriate analytical tools. By leveraging this strategy, traders can achieve lower-risk and higher-reward trades.

Improved Volume Based Indicator# Improved Volume Based Indicator
## Overview
The Improved Volume Based Indicator is a technical analysis tool designed to identify potential trading opportunities based on volume patterns, price action, and trend direction. This indicator combines volume analysis with moving averages and the Average True Range (ATR) to generate buy and sell signals.
## Key Components
1. Volume Analysis
- Tracks consecutive volume direction (up or down) for 3 periods
- Calculates volume ratio compared to a short-term moving average
2. Trend Direction
- Uses a 200-period Exponential Moving Average (EMA) to determine overall trend
3. Volatility Measurement
- Incorporates the Average True Range (ATR) for stop-loss and take-profit calculations
## Signal Generation
### Buy Signal Criteria
1. Three consecutive periods of up volume (close > open)
2. Volume ratio > 1.5 (current volume is 50% higher than the short-term average)
3. Current price is above the 200 EMA
### Sell Signal Criteria
1. Three consecutive periods of down volume (close < open)
2. Volume ratio > 1.5 (current volume is 50% higher than the short-term average)
3. Current price is below the 200 EMA
## Risk Management
The indicator calculates stop-loss and take-profit levels based on the ATR:
- Stop Loss: ATR * 1.5 (default)
- Take Profit: ATR * 2.5 (default)
These levels are adjustable through input parameters.
## Usage
1. Add the indicator to your chart
2. Adjust input parameters as needed:
- Volume Period (2-5)
- ATR Period (default 14)
- ATR Multipliers for Stop Loss and Take Profit
- EMA Period (default 200)
3. Monitor for buy and sell signals
4. Use the provided stop-loss and take-profit levels for risk management
## Interpretation
- Buy signals suggest potential upward price movement
- Sell signals suggest potential downward price movement
- Always consider other factors and perform additional analysis before making trading decisions
## Limitations
- This indicator may generate false signals in choppy or ranging markets
- It's best used in conjunction with other technical analysis tools and fundamental analysis
- Past performance does not guarantee future results
Remember to thoroughly test this indicator on historical data and in various market conditions before using it in live trading.
---
# 改進的基於交易量的指標
## 概述
改進的基於成交量的指標是一種技術分析工具,旨在根據成交量模式、價格行為和趨勢方向識別潛在的交易機會。此指標將成交量分析與移動平均線和平均真實波動幅度 (ATR) 結合起來,以產生買入和賣出訊號。
## 關鍵部件
1. 成交量分析
- 追蹤 3 個週期的連續成交量方向(向上或向下)
- 計算與短期移動平均線相比的成交量比率
2. 趨勢方向
- 使用 200 週期指數移動平均線 (EMA) 來確定整體趨勢
3. 波動率測量
- 納入平均真實波動範圍 (ATR) 以進行停損和停盈計算
## 訊號生成
### 購買訊號標準
1. 連續三個週期的成交量上漲(收盤>開盤)
2.成交量比率>1.5(目前成交量較短期平均高50%)
3. 當前價格高於200 EMA
### 賣出訊號標準
1.連續三個週期的成交量下跌(收盤<開盤)
2.成交量比率>1.5(目前成交量較短期平均高50%)
3. 目前價格低於200 EMA
## 風險管理
此指標根據 ATR 計算停損和止盈水準:
- 停損:ATR * 1.5(預設)
- 止盈:ATR * 2.5(預設)
這些等級可透過輸入參數進行調整。
## 用法
1. 將指標加入您的圖表中
2. 根據需要調整輸入參數:
- 卷期 (2-5)
- ATR 週期(預設 14)
- 用於停損和止盈的 ATR 乘數
- EMA 週期(預設 200)
3. 監控買賣訊號
4. 使用提供的停損和停利水準進行風險管理
## 解釋
- 買進訊號表示價格可能上漲
- 賣出訊號表示價格可能下跌
- 在做出交易決策之前始終考慮其他因素並進行額外分析
## 限制
- 此指標可能會在波動或波動的市場中產生錯誤訊號
- 最好與其他技術分析工具和基本面分析結合使用
- 過去的表現並不能保證未來的結果
請記住,在實際交易中使用該指標之前,請根據歷史數據和各種市場條件徹底測試該指標。

Easy Scalping Lot Calculator for ForexThe calculator was created to make it easier to calculate the lot size on Forex. I planned to use it for the following pairs: AUDCAD, AUDCHF, AUDJPY, AUDUSD, EURAUD, EURCAD, EURCHF, EURGBP, EURJPY, EURNZD, EURUSD, GBPCHF, GBPJPY, GBPUSD, NZDUSD, USDCAD, USDCHF, USDJPY, XAUUSD.
The indicator is a table that shows the calculation of the lot for a predetermined stop loss.
For example, you are planning a trade, have calculated a stop loss of 15 points, and by checking the table you understand approximately what lot you need to use to limit your risk.
In the settings you can change the risk and also determine the stop loss value in points.
The calculator does not take into account the spread in the calculations.
There are websites where you can accurately calculate the lot, but if you trade on small time frames this is not suitable for you.
The calculator uses the formula:
Lot size = maximum risk / stop loss (in pips) / minimum pip value x minimum trading lot.

Scalping System by Machine# Custom Trading System Indicator
This Pine Script indicator is designed to identify potential trading setups based on a specific set of rules. It's intended for use on lower timeframes (M1-M5) in the forex market, particularly during the New York-London overlap period.
## Key Features
1. **EMA Condition**: Uses a 20-period Exponential Moving Average (EMA) to determine trend direction.
2. **Candle Analysis**: Identifies strong bars and candle color changes.
3. **Volume Confirmation**: Checks for increasing volume.
4. **Volatility Filter**: Utilizes the Average True Range (ATR) to gauge market volatility.
5. **Time-based Filter**: Highlights the New York-London overlap period.
6. **Visual Aids**: Plots potential entry points, stop losses, and take profit levels.
## Trading Rules
1. **Buy Signal**:
- Price is above the 20 EMA
- Candle color changes from red to green
- Current candle is a strong bar (closing within 75% of its range)
- Volume is higher than the previous bar
- ATR(14) is above 4 pips OR it's during the NY-London overlap
2. **Sell Signal**:
- Price is below the 20 EMA
- Candle color changes from green to red
- Current candle is a strong bar (closing within 75% of its range)
- Volume is higher than the previous bar
- ATR(14) is above 4 pips OR it's during the NY-London overlap
3. **Stop Loss**: Placed near the low of the setup candle for buys, or near the high for sells.
4. **Take Profit**: Aimed at 1R (one times the range of the setup candle).
## Visual Elements
- **20 EMA**: Plotted as a blue line on the chart.
- **Buy Signals**: Green triangles below the candles.
- **Sell Signals**: Red triangles above the candles.
- **Stop Loss Levels**: Small red dots at the calculated stop loss prices.
- **Take Profit Levels**: Small green dots at the calculated take profit prices.
- **Information Table**: Displays current values for ATR, strong bar condition and volume condition.
## Usage Notes
1. This indicator is designed for manual trading, not automated execution.
2. It works best when combined with analysis of major trend lines, support, and resistance levels.
3. Exercise caution with very large setup candles.
4. Consider additional filters or money management rules for enhanced performance.
5. For higher timeframe bias validation, consider incorporating a 100-period break of structure (BOS) analysis.
## Customization
The indicator includes several input parameters that can be adjusted:
- EMA Length
- ATR Length and Threshold
- Volume Multiplier
- Strong Bar Percentage
Users can also toggle the visibility of stop loss and take profit markers.
Remember, while this indicator can identify potential setups, it should be used in conjunction with other forms of analysis and risk management strategies. Always consider the overall market context and your personal risk tolerance when making trading decisions.

MAC Investor V3.0 [VK]This indicator combines multiple functionalities to assist traders in making informed decisions. It primarily uses Heikin Ashi candles, Moving Averages, and a Price Action Channel (PAC) to provide signals for entering and exiting trades. Here's a detailed breakdown:
Inputs
MAC Length: Sets the length for the PAC calculation.
Use Heikin Ashi Candles: Option to use Heikin Ashi candles for calculations.
Show Coloured Bars around MAC: Option to color bars based on their relation to the PAC.
Show Long/Short Signals: Options to display long and short signals.
Show MAs? : Option to show moving averages on the chart.
Show MAs Trend at the Bottom?: Option to show trend signals at the bottom of the chart.
MA Lengths: Length settings for three different moving averages.
Change MA Color Based on Direction?: Option to change the color of moving averages based on trend direction.
MA Higher TimeFrame: Allows setting a higher timeframe for moving averages.
Show SL-TP Lines: Option to display Stop Loss and Take Profit lines.
SL/TP Percentages: Set the percentages for Stop Loss and three levels of Take Profit.
Calculations and Features
Heikin Ashi Candles: Calculations are based on Heikin Ashi candle data if selected.
Price Action Channel (PAC): Uses Exponential Moving Averages (EMA) of the high, low, and close to create a channel.
Bar Coloring: Colors the bars based on their position relative to the PAC.
Long and Short Signals: Uses crossovers of the close price and PAC upper/lower bands to generate signals.
Moving Averages (MA): Plots three moving averages and colors them based on their trend direction.
Overall Trend Indicators: Uses triangles at the bottom of the chart to show the overall trend of the MAs.
Stop Loss and Take Profit Levels: Calculates and plots these levels based on user-defined percentages from the entry price.
Alerts: Provides alerts for long and short signals.
Use Cases and How to Use
Identifying Trends: The PAC helps to identify the trend direction. If the closing price is above the PAC upper band, it suggests an uptrend; if below the lower band, it suggests a downtrend.
Entering Trades: Use the long and short signals to enter trades. A long signal is generated when the closing price crosses above the PAC upper band, and a short signal is generated when it crosses below the PAC lower band.
Exit Strategies: Utilize the Stop Loss (SL) and Take Profit (TP) levels to manage risk and lock in profits. These levels are automatically calculated based on the entry price and user-defined percentages.
Trend Confirmation with MAs: The moving averages provide additional confirmation of the trend. When all three MAs are trending in the same direction (e.g., all green for an uptrend), it adds confidence to the trade signal.
Overall Trend Indicators: The triangles at the bottom of the chart show the overall trend direction of the MAs:
Green Triangle: All three MAs are trending upwards, indicating a strong uptrend.
Red Triangle: All three MAs are trending downwards, indicating a strong downtrend.
Yellow Triangle: Mixed signals from the MAs, indicating no clear trend.
Bar Coloring for Quick Analysis: The colored bars give a quick visual cue about the market condition, aiding in faster decision-making.
Alerts: Set up alerts to get notified when a long or short signal is generated, allowing you to act promptly without constantly monitoring the chart.
Maximizing Profit
To maximize profit with this indicator:
Follow the Signals: Use the long and short signals to time your entries. Ensure you follow the trend indicated by the PAC and MAs.
Risk Management: Always set your Stop Loss and Take Profit levels to manage risk. This will help you cut losses early and secure profits.
Confirm with MAs: Look for confirmation from the moving averages. When all MAs align with the signal, it indicates a stronger trend.
Overall Trend Indicators: Pay attention to the triangles at the bottom for overall trend confirmation. Only enter trades when the overall trend is in your favor.
Heikin Ashi for Smoothing: Use Heikin Ashi candles for smoother trends and fewer false signals.
Backtesting: Test the indicator on historical data to understand its performance and adjust settings as necessary.
Adapt to Market Conditions: Adjust the lengths of PAC and MAs based on the market's volatility and timeframe you are trading on.
How to Use the Indicator
Add to Chart: Add the indicator to your TradingView chart.
Configure Settings: Customize the input settings to fit your trading strategy and timeframe.
Monitor Signals: Watch for long and short signals and observe the trend direction with the PAC and MAs.
Check Overall Trend: Look at the triangles at the bottom of the chart to see the overall trend direction of the MAs.
Set Alerts: Configure alerts to get notified of new signals.
Manage Trades: Use the SL and TP levels to manage your trades effectively.

First 12 Candles High/Low BreakoutThis indicator identifies potential breakout opportunities based on the high and low points formed within the first 12 candles after the market opens on a 5-minute timeframe. It provides visual cues and labels to help traders make informed decisions.
Features:
Market Open High/Low: Marks the highest and lowest price of the first 12 candles following the market open with horizontal lines for reference.
Breakout Signals: Identifies potential buy or sell signals based on the first 5-minute candle closing above the open high or below the open low.
Target and Stop-Loss: Plots horizontal lines for target prices (100 points by default, adjustable) and stop-loss levels (100 points by default, adjustable) based on the entry price.
Visual Cues: Uses green triangles (up) for buy signals and red triangles (down) for sell signals.
Informative Labels: Displays labels with "Buy" or "Sell" text, target price, and stop-loss price next to the entry signals (optional).
Customization:
You can adjust the target and stop-loss point values using the provided inputs.
How to Use:
Add the script to your TradingView chart.
The indicator will automatically plot the open high, open low, potential entry signals, target levels, and stop-loss levels based on the first 12 candles after the market opens.
Use the signals and price levels in conjunction with your own trading strategy to make informed decisions.

SLOPED Trailing SL with ATR-V1SLOPED Trailing SL with ATR
I thought capital is sometime locked for long periods s when volatility is low, hence:
SLOPED Trailing SL with ATR
This indicator provides a trailing stop loss that dynamically adjusts based on the Average True Range (ATR) and incorporates a user-defined upward slope on flat areas. It is designed to follow the price movement more closely during trends while allowing for a customizable slope to maintain a trailing stop even when the price movement is flat.
Key Features:
ATR-Based Stop Loss:
Utilizes the ATR to calculate a dynamic stop loss level, adjusting to market volatility.
Provides a normal ATR stop loss line that only trails upwards, preventing it from decreasing.
Upward Slope on Flat Areas:
Adds a user-defined upward slope to the trailing stop loss when the price movement is flat.
The slope value is specified in 1/1000 increments (e.g., 0.1% per bar), allowing for fine-tuned control.

Tetuan SniperThe TEMA and EMA Crossover Alert with SL, TP, and Order Signal strategy combines the power of Triple Exponential Moving Average (TEMA) and Exponential Moving Average (EMA) to generate high-quality trading signals. This strategy is designed to provide clear entry and exit points, manage risk through dynamic Stop Loss (SL) and Take Profit (TP) levels, and optimize trade sizes based on account balance and risk tolerance.
Key Features:
EMA and TEMA Crossover:
The strategy identifies potential buy and sell signals based on the crossover of EMA and TEMA. A buy signal is generated when TEMA crosses above EMA, and a sell signal is generated when TEMA crosses below EMA.
Dynamic Stop Loss (SL) and Take Profit (TP):
Stop Loss levels are dynamically set based on a user-defined number of pips below (for buy orders) or above (for sell orders) the lowest or highest point since the crossover.
Take Profit levels are dynamically adjusted using another TEMA, providing a flexible exit strategy that adapts to market conditions.
Lot Size Calculation:
The strategy calculates the optimal lot size based on the account balance, risk percentage per trade, and the number of maximum open orders. For JPY pairs, the lot size is adjusted by dividing by 100 to account for the different pip value.
The lot size is rounded to two decimal places for better readability and precision.
Visual Alerts and Labels:
Clear visual alerts and labels are provided for each buy and sell signal, including the recommended SL, TP, and lot size. The labels are placed in a way to avoid overlapping important chart elements.
Trend Visualization:
The area between the TEMA and EMA is colored to indicate the trend, with green for bullish trends and red for bearish trends, making it easy to visualize the market direction.
Inputs:
SL Points: Number of pips for the Stop Loss.
EMA Period: Period for the Exponential Moving Average.
TEMA Period: Period for the Triple Exponential Moving Average.
Account Balance: The total account balance for calculating the lot size.
Risk Percentage: The percentage of the account balance to risk per trade.
Take Profit TEMA Period: Period for the TEMA used to set Take Profit levels.
Lot per Pip Value: The value of 1 pip per lot.
Maximum Open Orders: The maximum number of open orders to split the balance among.
Example Usage
This strategy is suitable for traders who want to automate their trading signals and manage risk effectively. By combining TEMA and EMA crossovers with dynamic SL and TP levels and precise lot size calculation, traders can achieve a disciplined and methodical approach to trading.

[MAD] Entrytool / Bybit-LinearThis indicator, "Entry Tool," was coded at request for Sandmann .
It is designed to provide traders with real-time feedback for strategizing entries, exits, and liquidation levels for trades initiated at that given moment.
The tool visualizes average entry prices, stop-loss levels, multiple take-profit targets, and potential liquidation prices, offering a comprehensive overview of possible trade outcomes. It aids traders in pre-planning their trades by visually simulating the impact of different trading decisions directly on the live chart. Each setting and parameter can be customized to align with individual trading strategies and risk tolerances, making this tool versatile for various trading styles, including day trading, swing trading, and position trading.
------------------------------
Steps to Use the Indicator:
1. Basic Setup:
Setup Type: Choose between "Long" or "Short" to set the direction of the trade.
Leverage: Adjust the leverage to understand its impact on your potential returns and liquidation price.
Tracking follows the close price, alternative you can enter a specific price.
2. Position Setup:
Initial Entry Amount: Set the starting amount for the trade.
Distance: First Increment Percentage from Entry price
Amount: Define the increase for the first incremental addition to the position and specify the amount to be added.
Distance: Second Increment Percentage from Entry
Amount: Set the increase for the second incremental addition and the corresponding amount.
3. Risk Management:
Stop-Loss (SL) Percentage: Set the percentage below or above the average entry price at which the position should be closed to minimize losses.
Take-Profit (TP) Percentages: Define up to four different profit target levels by specifying the percentage above or below the average entry price.
4. Visual Settings:
Box Colors: Customize the colors of the boxes that represent long and short positions to differentiate easily on the chart.
Box Extension: Determine the length by which the box extends beyond the current bar, which helps in visualizing the potential price movement.
Line Colors and Extensions: Select colors for various lines such as the Average Entry Line, Stop-Loss Line, Take-Profit Lines, and Liquidations Line. Adjust the length of these lines for better visibility.
Label Settings: Configure the distance of labels from their corresponding lines and set the font size for better readability.
5. Additional Features:
Liquidation Price Visualization: This new feature calculates and displays the liquidation price based on the current leverage and margin settings, giving traders a critical insight into their risk exposure.
Interactive Drag Point: Adjust the start price manually by dragging the point on the chart, which dynamically updates entry and exit levels as well as risk metrics.
Detailed Leverage Data Array: Input different scenarios with specific leverage, initial margin, and maintenance rates to see how these factors impact potential liquidation points.
6. Informations about leverage calculation
The data used are fetched from Bybit for Linear pairs to calculate the liquidations like in their documentation.
Keep in mind that other exchanges may calulate based on another formular.

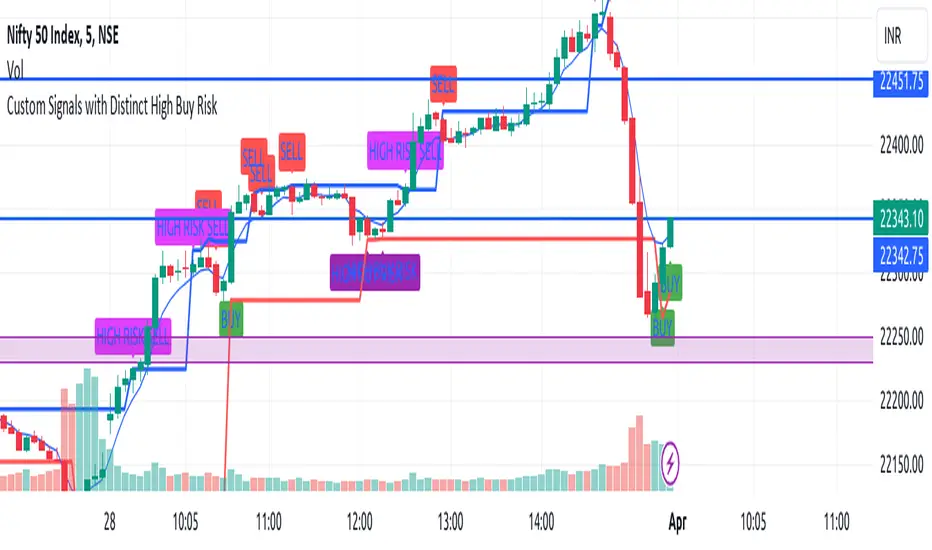
EngineerBuySellHighRiskThis TradingView indicator script is designed to identify various trading signals based on price action and the 5-period Exponential Moving Average (EMA), providing traders with insights into potential buy and sell opportunities. The script generates signals under the following categories:
Buy Signals
Regular Buy Signal: Identified when the entire previous candle (Candle 1) is below the 5 EMA, and the following candle (Candle 2) has a higher high compared to Candle 1 and closes higher than its opening price (indicating a green candle). This signal suggests a potential upward momentum as the price moves above the recent lows and the 5 EMA, indicating a buying opportunity.
High-Risk Buy Signal: Similar to the regular buy signal, but it specifically targets scenarios where Candle 1's high is exactly on the 5 EMA. Candle 2 must either have a higher high than Candle 1 or touch the 5 EMA, and it must close higher than its opening price. This signal indicates a potential for an upward trend continuation but is considered higher risk due to the price's proximity to the 5 EMA.
High Buy Risk Signal: This signal is generated under the same conditions as the regular buy signal regarding the position of Candle 1 relative to the 5 EMA and the requirement for Candle 2 to have a higher high. However, it allows for Candle 2 to close lower than its opening price (indicating a red candle), broadening the criteria for a buy signal. This modification acknowledges the potential for buying opportunities even in cases where Candle 2 closes down, assuming the price still shows upward momentum compared to Candle 1.
Sell Signals
Sell Signal: Generated when Candle 1 is entirely above the 5 EMA, and the following candle (Candle 2) has a lower low compared to Candle 1 and closes lower than its opening price (indicating a red candle). This setup suggests a potential downward trend, signaling a selling or shorting opportunity.
High Risk Sell Signal: This signal is for scenarios where Candle 1 is above the 5 EMA, and Candle 2's low is lower than Candle 1's low, but unlike the standard sell signal, it allows Candle 2 to close higher than its opening price (indicating a green candle). It signifies a potential downward price movement but with increased risk due to the mixed signal from Candle 2's close.
Stop-Loss Levels
Buy Stop-Loss Level: For buy signals, the stop-loss is set at the low of Candle 1, providing a risk management level to minimize potential losses if the market moves against the trade.
Sell Stop-Loss Level: For sell signals, the stop-loss is set at the high of Candle 1, serving as a risk management tool to protect against unfavorable price movements after entering a short position.
Visualization
The script uses different colors and labels to distinguish between the types of signals, making it easier for traders to identify and act upon these trading opportunities. It plots the 5 EMA for reference, providing context for the price action relative to this moving average. This script aims to offer a comprehensive toolkit for traders looking for nuanced entry and exit points based on short-term price movements and momentum relative to the 5 EMA.
Liquidity Finder🔵 Introduction
The concept of "liquidity pool" or simply "liquidity" in technical analysis price action refers to areas on the price chart where stop losses accumulate, and the market, by reaching those areas and collecting liquidity (Stop Hunt), provides the necessary energy to move the price. This concept is prominent in the "ICT" and "Smart Money" styles. Imagine, as depicted below, the price is at a support level. The general trader mentality is that there is "demand" for the asset at this price level, and this demand will outweigh "supply" as before. So, it is likely that the price will increase. As a result, they start buying and place their stop loss below the support area.
Stop Hunt areas are essentially traders' "stop loss" levels. These are the liquidity that institutional and large traders need to fill their orders. Consequently, they penetrate the price below support areas or above resistance areas to touch their stop loss and fill their orders, and then the price trend reverses.
Cash zones are generally located under "Swings Low" and above "Swings High." More specifically, they can be categorized as support levels or resistance levels, above Double Top and Triple Top patterns, below Double Bottom and Triple Bottom patterns, above Bearish Trend lines, and below Bullish Trend lines.
Double Top and Triple Top :
Double Bottom and Triple Bottom :
Bullish Trend line and Bearish Trend line :
🔵 How to Use
To optimally use this indicator, you can adjust the settings according to the symbol, time frame, and your needs. These settings include the "sensitivity" of the "liquidity finder" function and the swing periods related to static and dynamic liquidity lines.
"Statics Liquidity Line Sensitivity" is a number between 0 and 0.4. Increasing this number decreases the sensitivity of the "Statics Liquidity Line Detection" function and increases the number of lines identified. The default value is 0.3.
"Dynamics Liquidity Line Sensitivity" is a number between 0.4 and 1.95. Increasing this number increases the sensitivity of the "Dynamics Liquidity Line Detection" function and decreases the number of lines identified. The default value is 1.
"Statics Period Pivot" is set to 8 by default. By changing this number, you can specify the period for the static liquidity line pivots.
"Dynamics Period Pivot" is set to 3 by default. By changing this number, you can specify the period for the dynamic liquidity line pivots.
🔵 Settings
Access to adjust the inputs of Static Dynamic Liquidity Line Sensitivity, Dynamics Liquidity Line Sensitivity, Statics Period Pivot, and Dynamics Period Pivot is possible from this section.
Additionally, you can enable or disable liquidity lines as needed using the buttons for "Show Statics High Liquidity Line," "Show Statics Low Liquidity Line," "Show Dynamics High Liquidity Line," and "Show Dynamics Low Liquidity Line."

Targets For Overlay Indicators [LuxAlgo]The Targets For Overlay Indicators is a useful utility tool able to display targets during crossings made between the price and external indicators on the user chart. Users can display a series of two targets, one for crossover events and another one for crossunder event.
Alerts are included for the occurrence of a new target as well as for reached targets.
🔶 USAGE
In order for targets to be displayed users need to select an appropriate input source from the "Source" drop-down input setting. In the example above we apply the indicator to a volatility stop.
This can also easily be done by adding the "Targets For Overlay Indicators" script on the VStop indicator directly.
Targets can help users determine the price limit where the price might start deviating from an indication given by one or multiple indicators. In the context of trading, targets can help secure profits/reduce losses of a trade, as such this tool can be useful to evaluate/determine user take profits/stop losses.
Due to these essentially being horizontal levels, they can also serve as potential support/resistances, with breakouts potentially confirming new trends.
Users might be interested in obtaining new targets once one is reached, this can be done by enabling "New Target When Reached" in the target logic setting section, resulting in more frequent targets.
Lastly, users can restrict new target creation until current ones are reached. This can result in fewer and longer-term targets, with a higher reach rate.
🔹 Examples
The indicator can be applied to many overlay indicators that naturally produce crosses with the price, such as moving average, trailing stops, bands...etc.
Users can use trailing stops such as the SuperTrend or VStop to more easily create clean targets. Do note that certain SuperTrend scripts separate the upper and lower extremities of the SuperTrend into two different plot, which cannot be used with this tool, you may use the provided SuperTrend script below to have a compatible version with our tool:
//@version=5
indicator("SuperTrend", overlay = true)
factor = input.float(3, 'Factor', minval = 0)
atrLen = input.int(10, 'ATR Length', minval = 1)
= ta.supertrend(factor, atrLen)
plot(spt, 'SuperTrend', dir != dir ? na : dir < 0 ? #089981 : #f23645, 2)
plot(spt, 'Circles', dir > dir ? #f23645 : dir < dir ? #089981 : na, 3, plot.style_circles)
Using moving averages can produce more targets than other overlay indicators.
Users can apply the tool twice when using bands or any overlay indicator returning two outputs, using crossover targets for obtaining targets using the upper band as source and crossunder targets for targets using the lower band. We can also use the Trendlines with breaks indicator as example:
🔹 Dashboard
A dashboard is displayed on the top right of the chart, displaying the amount, reach rate of targets 1/2, and total amount.
This dashboard can be useful to evaluate the selected target distances relative to the selected conditions, with a higher reach rate suggesting the distance of the targets from the price allows them to be reached.
🔶 SETTINGS
Source: Indicator source used to create targets. Targets are created when the closing price crosses the specified source.
Show Target Labels: Display target labels on the chart.
Candle Coloring: Apply candle coloring based on the most recent active target.
🔹 Target
Crossover and Crossunder targets use the same settings below:
Show Target: Determines if the target is displayed or not.
Above Price Target: If selected, will create targets above the closing price.
Wait Until Reached: When enabled will not create a new target until an existing one is reached.
New Target When Reached: Will create a new target when an existing one is reached.
Evaluate Wicks: Will use high/low prices to determine if a target is reached. Unselecting this setting will use the closing price.
Target Distance From Price: Controls the distance of a target from the price. Can be determined in currencies/points, percentages, ATR multiples, or ticks.

buy/sell signals with Support/Resistance (InvestYourAsset) 📣The present indicator is a MACD based buy/sell signals indicator with support and resistance, that can be used to identify potential buy and sell signals in a security's price.
📣It is based on the MACD (Moving Average Convergence Divergence) indicator, which is a momentum indicator that shows the relationship between two moving averages of a security's price.
📣 The indicator also plots support and resistance levels, which can be used to confirm buy and sell signals. The support and resistance can also be used as a stoploss for existing position.
👉 To use the indicator, simply add it to your trading chart. The indicator will plot three sections:
📈 Price and Signals: This section plots the security's price and the MACD buy and sell signals.
📈 MACD Oscillator: This section plots the MACD oscillator, which is a histogram that shows the difference between the two moving averages.
📈 Moving Averages: This section plots the two moving averages that the MACD oscillator is based on.
📈 Support and Resistance: This section plots support and resistance levels, which are calculated based on the security's recent price action.
👉 To identify buy and sell signals, you can look for the following:
📈 Buy signal: When shorter Moving Average crosses over longer Moving Average.
📈 Sell signal: When shorter moving average crosses under longer moving average.
📈 You can also look for divergences between the MACD oscillator and the security's price. A divergence occurs when the MACD oscillator is moving in one direction, but the security's price is moving in the opposite direction. Divergences can be a sign of a potential trend reversal.
👉 To confirm buy and sell signals, you can look for support and resistance levels take a look at below snapshot. If a buy signal occurs at a support level, it is a stronger signal than if it occurs at a random price level. Similarly, if a sell signal occurs at a resistance level, it is a stronger signal than if it occurs at a random price level.
⚡ Here is a example of how to use the indicator to identify buy signal:
☑ Add the indicator to your trading chart.
☑Look for a buy signal when short MA crosses over Long MA.
☑Look for the buy signal to occur at a support level.
☑Enter a long position at the next candle.
☑Place a stop loss order below the support level.
☑Take profit when the MACD line crosses below the signal line, or when the security reaches a resistance level.
⚡ Here is an example of how to use the indicator to identify a sell signal:
☑Add the indicator to your trading chart.
☑Look for a sell signal, when shorter moving average crosses under longer moving average.
☑Look for the sell signal to occur at a resistance level.
☑Enter a short position at the next candle.
☑Place a stop loss order above the resistance level.
☑Take profit when the MACD line crosses above the signal line, or when the security reaches a support level.
✅Things to consider while using the indicator:
📈Look for buy signals in an uptrend and sell signals in a downtrend. This will increase the likelihood of your trades being successful.
📈Place your stop losses below the previous swing low or support for buy signals and above the previous swing high or resistance for sell signals. This will help to limit your losses if the trade goes against you.
📈Consider taking profits at key resistance and support levels. This will help you to lock in your profits and avoid giving them back to the market.
Follow us for timely updates regarding indicators that we may publish in future and give it a like if you appreciate the indicator.
