Indicators
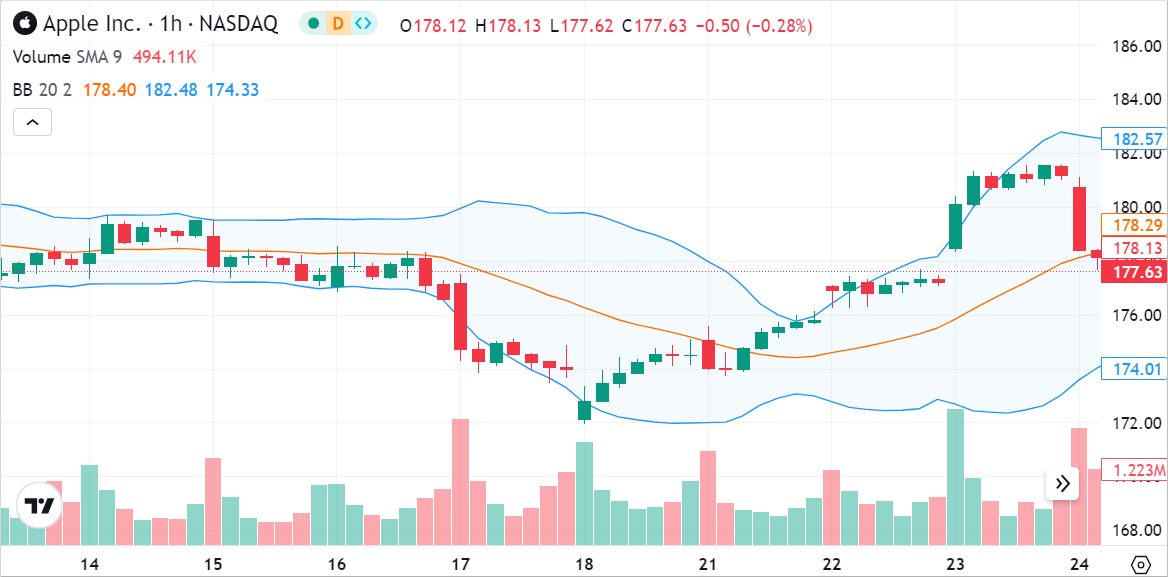
An indicator (study) is a mathematical function built based on trading statistics such as opening and closing prices, minimum and maximum prices, trading volumes, and more. You can make predictions about the future movement of the market by analyzing changes in values of the indicator. The values of indicator functions can be displayed on the chart in the form of lines, columns, points, and geometric figures. For more information about indicators, refer to the Technical Indicator article.
Built-in indicators
Advanced Charts and Trading Platform support more than 100 indicators. Refer to Indicators List to see all available indicators.
Custom indicators
You can create your custom indicators in JavaScript. Refer to Custom Studies for more information. Note that Pine Script® is not supported in the libraries.
Add an indicator
Indicators can be added in the UI and using the API.
UI
Users can add indicators in the UI as demonstrated below.
Users can also change the indicator's parameters in the Settings dialog.
Users cannot see or change the code of built-in or custom indicators.
API
You can use the createStudy method to add an indicator to the chart. The method has the inputs parameter that allows you to specify an indicator's options. To get a list of options available for a certain indicator, call the getStudyInputs method and pass the indicator's name as a parameter. Note that the indicator's name should match the one provided in the drop-down list.
widget.getStudyInputs('MACD');
The code sample below demonstrates how to create an indicator.
widget.activeChart().createStudy('MACD', false, false, { in_0: 14, in_1: 30, in_3: 'close', in_2: 9 });
widget.activeChart().createStudy('Moving Average Exponential', false, false, { length: 26 });
widget.activeChart().createStudy('Stochastic', false, false, { in_0: 26 }, {"%d.color" : "#FF0000"});
widget.activeChart().createStudy('Price Channel', true, false, { in_0: 26 }, null, {checkLimit: false, priceScale: 'new-left'});
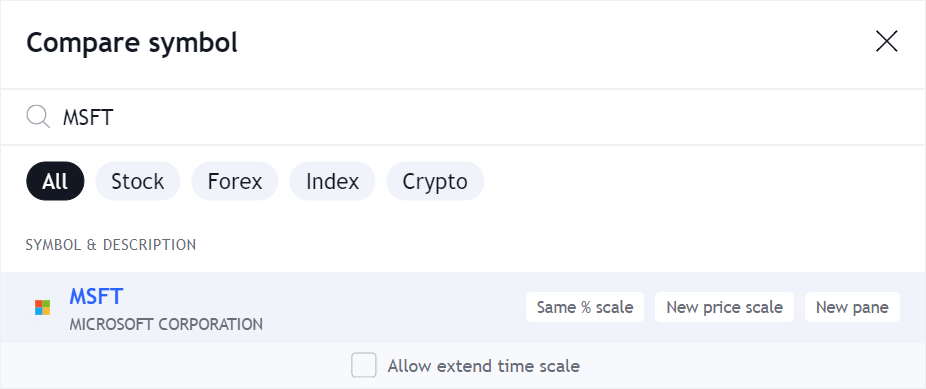
Add and compare new series
Users can add new series to the chart to compare symbols. To do this in the UI, users should click the Compare or Add Symbol button. They can also specify a price scale and display the new symbol on a new pane.
To add a symbol programmatically, you should use the Overlay indicator.
widget.activeChart().createStudy('Overlay', true, false, { symbol: 'IBM' });
Alternatively, you can use the Compare indicator that allows you to additionally specify the data source. However, unlike Overlay, this indicator does not support the Allow extend time scale feature or logos in the Legend.
widget.activeChart().createStudy('Compare', false, false, { source: 'open', symbol: 'IBM'});
Visibility customization
Hide indicators
You can use the studies_access property of the Widget Constructor to customize the list of indicators available to users. For example, you can hide some indicators or only make them available to certain users.
Check out the Widget Constructor tutorial on YouTube for an implementation example.
Hide volume-based indicators
If your datafeed does not provide volume data and you want to hide all volume-based indicators, you should add the indicators below to the blacklist in studies_access.
- Accumulation/Distribution
- Chaikin Money Flow
- Ease of Movement
- Elders Force Index
- Klinger Oscillator
- Money Flow Index
- Net Volume
- On Balance Volume
- Price Volume Trend
- VWAP
- Volume Oscillator
Hide the Volume indicator
The library adds the Volume indicator to all financial instruments that have volume data. If you do not want to show this indicator, you should include the create_volume_indicator_by_default featureset in the disabled_features array.
Limit indicator amount
You can use the study_count_limit property of the Widget Constructor to set the maximum amount of indicators that can be displayed on the chart simultaneously.
Style customization
You can use the studies_overrides property of the Widget Constructor to specify the indicator's default parameters such as colors, line width, a plot type, and more. Refer to the Indicator Overrides article for more information on how to customize an indicator.
Indicator API
After an indicator is created, you can manage it using IStudyApi.
For example, you can change the indicator's visibility or position. Refer to IStudyApi for more information.