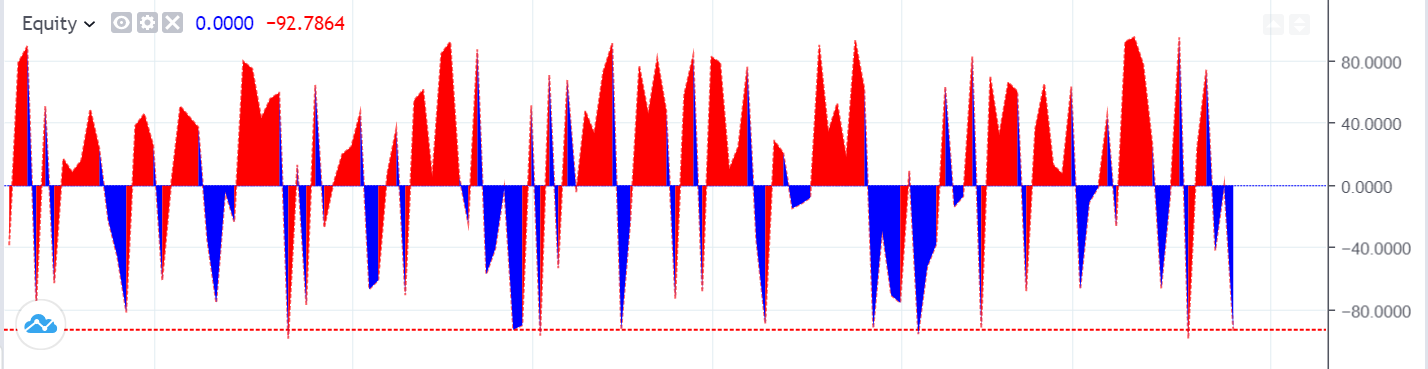
Custom Studies Examples
Requesting Data for Another Ticker
- JavaScript
- TypeScript
custom_indicators_getter: function(PineJS) {
    return Promise.resolve([
        {
            name: 'Equity',
            metainfo: {
                _metainfoVersion: 51,
                id: 'Equity@tv-basicstudies-1',
                description: 'Equity',
                shortDescription: 'Equity',
                is_price_study: true,
                isCustomIndicator: true,
                format: {
                    type: 'price',
                    // Precision is set to one digit, e.g. 777.7
                    precision: 1,
                },

                plots: [{id: 'plot_0', type: 'line'}],
                defaults: {
                    styles: {
                        plot_0: {
                            linestyle: 0,
                            visible: true,

                            // Make the line thinner
                            linewidth: 1,

                            // Plot type is Line
                            plottype: 2,

                            // Show price line
                            trackPrice: true,

                            // Set the plotted line color to dark red
                            color: '#880000'
                        }
                    },

                    inputs: {}
                },
                styles: {
                    plot_0: {
                        // Output name will be displayed in the Style window
                        title: 'Equity value',
                        histogramBase: 0,
                    }
                },
                inputs: [],
            },

            constructor: function() {
                this.init = function(context, inputCallback) {
                    this._context = context;
                    this._input = inputCallback;

                    const symbol = '#EQUITY'; // #EQUITY should be replaced with the symbol you want to resolve
                    this._context.new_sym(symbol, PineJS.Std.period(this._context));
                };

                this.main = function(context, inputCallback) {
                    this._context = context;
                    this._input = inputCallback;
                    // Select the main symbol
                    this._context.select_sym(0);
                    const mainSymbolTime = this._context.new_var(this._context.symbol.time);

                    // Select the secondary symbol
                    this._context.select_sym(1);
                    const secondarySymbolTime = this._context.new_var(this._context.symbol.time);

                    // Align the times of the secondary symbol to the main symbol
                    const secondarySymbolClose  = this._context.new_var(PineJS.Std.close(this._context));
                    const alignedClose = secondarySymbolClose.adopt(secondarySymbolTime, mainSymbolTime, 1);

                    // Select the main symbol again
                    this._context.select_sym(0);

                    return [alignedClose];
                }
            }
        }
    ]);
},
/* Within the Widget constructor options */
custom_indicators_getter: PineJS => {
    return Promise.resolve<CustomIndicator[]>([

        /* Requesting data for another ticker */
        {
            name: 'Equity',
            metainfo: {
                _metainfoVersion: 51,
                id: 'Equity@tv-basicstudies-1' as RawStudyMetaInfoId,
                description: 'Equity',
                shortDescription: 'Equity',
                is_price_study: true,
                isCustomIndicator: true,
                format: {
                    type: 'price',
                    // Precision is set to one digit, e.g. 777.7
                    precision: 1,
                },

                plots: [{ id: 'plot_0', type: StudyPlotType.Line }],
                defaults: {
                    styles: {
                        plot_0: {
                            linestyle: 0,
                            visible: true,

                            // Make the line thinner
                            linewidth: 1,

                            // Plot type is Line
                            plottype: 2 as StudyLinePlotPreferences['plottype'],

                            // Show price line
                            trackPrice: true,

                            // Set the plotted line color to dark red
                            color: '#880000',
                        },
                    },

                    inputs: {},
                },
                styles: {
                    plot_0: {
                        // Output name will be displayed in the Style window
                        title: 'Equity value',
                        histogramBase: 0,
                    },
                },
                inputs: [],
            },

            constructor: function (
                this: LibraryPineStudy<IPineStudyResult>
            ) {
                this.init = function (context, inputCallback) {
                    this._context = context;
                    this._input = inputCallback;

                    const symbol = '#EQUITY'; // #EQUITY should be replaced with the symbol you want to resolve
                    this._context.new_sym(
                        symbol,
                        PineJS.Std.period(this._context)
                    );
                };

                this.main = function (context, inputCallback) {
                       this._context = context;
                    this._input = inputCallback;
                    // Select the main symbol
                    this._context.select_sym(0);
                    const mainSymbolTime = this._context.new_var(this._context.symbol.time);

                    // Select the secondary symbol ("#EQUITY")
                    this._context.select_sym(1);
                    const secondarySymbolTime = this._context.new_var(this._context.symbol.time);

                    // Align the times of the secondary symbol to the main symbol
                    const secondarySymbolClose  = this._context.new_var(PineJS.Std.close(this._context));
                    const alignedClose = secondarySymbolClose.adopt(secondarySymbolTime, mainSymbolTime, 1);

                    // Select the main symbol again
                    this._context.select_sym(0);

                    return [alignedClose];
                };
            },
        },
    ]);
},
Coloring Bars

- JavaScript
- TypeScript
custom_indicators_getter: function (PineJS) {
    return Promise.resolve([
        {
            name: 'Bar Colorer Demo',
            metainfo: {
                _metainfoVersion: 51,

                id: "BarColoring@tv-basicstudies-1",
                name: "BarColoring",
                description: "Bar Colorer Demo",
                shortDescription: "Bar Coloring",

                isCustomIndicator: true,
                is_price_study: true,

                format: {
                    type: 'price',
                    precision: 4,
                },

                defaults: {
                    palettes: {
                        palette_0: {
                            // palette colors
                            // change it to the default colors that you prefer,
                            // but note that the user can change them in the Style tab
                            // of indicator properties
                            colors: [
                                { color: '#FFFF00' },
                                { color: '#0000FF' }
                            ]
                        }
                    }
                },
                inputs: [],
                plots: [{
                    id: 'plot_0',

                    // plot type should be set to 'bar_colorer'
                    type: 'bar_colorer',

                    // this is the name of the palette that is defined
                    // in 'palettes' and 'defaults.palettes' sections
                    palette: 'palette_0'
                }],
                palettes: {
                    palette_0: {
                        colors: [
                            { name: 'Color 0' },
                            { name: 'Color 1' }
                        ],

                        // the mapping between the values that
                        // are returned by the script and palette colors
                        valToIndex: {
                            100: 0,
                            200: 1
                        }
                    }
                }
            },
            constructor: function() {
                this.main = function(context, input) {
                    this._context = context;
                    this._input = input;

                    var valueForColor0 = 100;
                    var valueForColor1 = 200;

                    // perform your calculations here and return one of the constants
                    // that is specified as a key in 'valToIndex' mapping
                    var result =
                        Math.random() * 100 % 2 > 1 ? // we randomly select one of the color values
                            valueForColor0 : valueForColor1;

                    return [result];
                }
            }
        }
    ]);
},
/* Within the Widget constructor options */
custom_indicators_getter: PineJS => {
    return Promise.resolve<CustomIndicator[]>([

        /* Coloring bars */
        {
            name: 'Bar Colorer Demo',
            metainfo: {
                _metainfoVersion: 51,

                id: 'BarColoring@tv-basicstudies-1' as RawStudyMetaInfoId,
                name: 'BarColoring',
                description: 'Bar Colorer Demo',
                shortDescription: 'BarColoring',

                isCustomIndicator: true,
                is_price_study: true,

                format: {
                    type: 'price',
                    precision: 4,
                },

                defaults: {
                    palettes: {
                        palette_0: {
                            // palette colors
                            // change it to the default colors that you prefer,
                            // but note that the user can change them in the Style tab
                            // of indicator properties
                            colors: [{ color: '#FFFF00' }, { color: '#0000FF' }],
                        },
                    },
                },
                inputs: [],
                plots: [
                    {
                        id: 'plot_0',

                        // plot type should be set to 'bar_colorer'
                        type: StudyPlotType.BarColorer,

                        // this is the name of the palette that is defined
                        // in 'palettes' and 'defaults.palettes' sections
                        palette: 'palette_0',
                    },
                ],
                palettes: {
                    palette_0: {
                        colors: [{ name: 'Color 0' }, { name: 'Color 1' }],

                        // the mapping between the values that
                        // are returned by the script and palette colors
                        valToIndex: {
                            100: 0,
                            200: 1,
                        },
                    },
                },
            },
            constructor: function (
                this: LibraryPineStudy<IPineStudyResult>
            ) {
                this.main = function (context, input) {
                    this._context = context;
                    this._input = input;

                    const valueForColor0 = 100;
                    const valueForColor1 = 200;

                    // perform your calculations here and return one of the constants
                    // that is specified as a key in 'valToIndex' mapping
                    const result =
                        (Math.random() * 100) % 2 > 1 // we randomly select one of the color values
                            ? valueForColor0
                            : valueForColor1;

                    return [result];
                };
            },
        },
    ]);
},
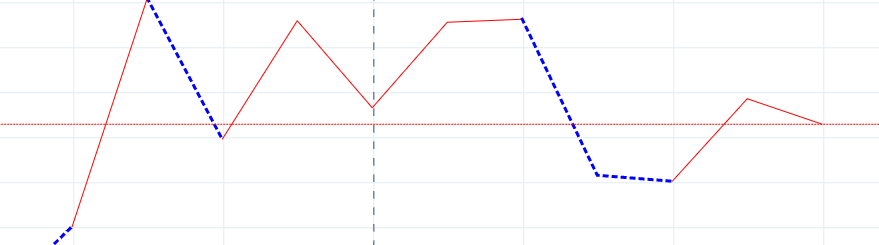
Custom Styles for Every Point
- JavaScript
- TypeScript
custom_indicators_getter: function(PineJS) {
    return Promise.resolve([
        {
            name: 'Custom Styles For Every Point',
            metainfo: {
                _metainfoVersion: 51,
                id: 'CustomStylesForEveryPoint@tv-basicstudies-1',
                description: 'Custom Styles For Every Point',
                shortDescription: 'Custom Styles For Every Point',
                is_price_study: false,
                isCustomIndicator: true,
                plots: [
                    {
                        'id': 'plot_0',
                        'type': 'line',
                    },
                    {
                        'id': 'plot_1',
                        'type': 'colorer',
                        'target': 'plot_0',
                        'palette': 'paletteId1',
                    },
                ],
                palettes: {
                    paletteId1: {
                        colors: {
                            0: {
                                    name: 'First color',
                            },
                            1: {
                                    name: 'Second color',
                            },
                        },
                    },
                },
                defaults: {
                    palettes: {
                        paletteId1: {
                            colors: {
                                0: {
                                    color: 'red',
                                    width: 1,
                                    style: 0,
                                },
                                1: {
                                    color: 'blue',
                                    width: 3,
                                    style: 1,
                                },
                            },
                        },
                    },
                    styles: {},
                    precision: 4,
                    inputs: {},
                },
                styles: {
                    plot_0: {
                        title: 'Equity value',
                        histogramBase: 0,
                    },
                },
                inputs: [],
                format: {
                    type: 'price',
                    precision: 4,
                },
            },
            constructor: function() {
                this.main = function(context, inputCallback) {
                    this._context = context;
                    this._input = inputCallback;

                    const value = Math.random() * 200;
                    const colorIndex = value > 100 ? 0 : 1;

                    return [value, colorIndex];
                }
            }
        }
    ]);
},
/* Within the Widget constructor options */
custom_indicators_getter: PineJS => {
    return Promise.resolve<CustomIndicator[]>([

        /* Custom styles for every point */
       {
            name: 'Custom Styles For Every Point',
            metainfo: {
                _metainfoVersion: 51,
                id: 'CustomStylesForEveryPoint@tv-basicstudies-1' as RawStudyMetaInfoId,
                description: 'Custom Styles For Every Point',
                shortDescription: 'Custom Styles For Every Point',
                is_price_study: false,
                isCustomIndicator: true,
                plots: [
                    {
                        id: 'plot_0',
                        type: StudyPlotType.Line,
                    },
                    {
                        id: 'plot_1',
                        type: StudyPlotType.Colorer,
                        target: 'plot_0',
                        palette: 'paletteId1',
                    },
                ],
                palettes: {
                    paletteId1: {
                        colors: {
                            0: {
                                name: 'First color',
                            },
                            1: {
                                name: 'Second color',
                            },
                        },
                    },
                },
                defaults: {
                    palettes: {
                        paletteId1: {
                            colors: {
                                0: {
                                    color: 'red',
                                    width: 1,
                                    style: 0,
                                },
                                1: {
                                    color: 'blue',
                                    width: 3,
                                    style: 1,
                                },
                            },
                        },
                    },
                    styles: {},
                    precision: 4,
                    inputs: {},
                },
                styles: {
                    plot_0: {
                        title: 'Equity value',
                        histogramBase: 0,
                    },
                },
                inputs: [],
                format: {
                    type: 'price',
                    precision: 4,
                },
            },
            constructor: function (
                this: LibraryPineStudy<IPineStudyResult>
            ) {
                this.main = function (context, inputCallback) {
                    this._context = context;
                    this._input = inputCallback;

                    const value = Math.random() * 200;
                    const colorIndex = value > 100 ? 0 : 1;

                    return [value, colorIndex];
                };
            },
        },
    ]);
},
Complex Filled Areas
- JavaScript
- TypeScript
custom_indicators_getter: function(PineJS) {
    return Promise.resolve([
        {
            name: 'Complex Filled Areas',
            metainfo: {
                _metainfoVersion: 51,
                id: 'ComplexFilledAreas@tv-basicstudies-1',
                description: 'Complex Filled Areas',
                shortDescription: 'Complex Filled Areas',
                is_price_study: false,
                isCustomIndicator: true,
                plots: [
                    {
                        id: 'plot_0',
                        type: 'line',
                    },
                    {
                        id: 'plot_1',
                        type: 'line',
                    },
                    {
                        id: 'plot_2',
                        type: 'colorer',
                        target: 'filledAreaId1',
                        palette: 'paletteId1',
                    },
                ],

                filledAreas: [
                    {
                        id: 'filledAreaId1',
                        objAId: 'plot_0',
                        objBId: 'plot_1',
                        title: 'Filled area between first and second plot',
                        type: 'plot_plot',
                        palette: 'paletteId1',
                    },
                ],

                palettes: {
                    paletteId1: {
                        valToIndex: {
                            0: 0,
                            1: 1,
                        },
                        colors: {
                            0: {
                                name: 'First color',
                            },
                            1: {
                                name: 'Second color',
                            },
                        },
                    },
                },
                defaults: {
                    filledAreasStyle: {
                        filledAreaId1: {
                            color: 'yellow',
                            visible: true,
                            transparency: 40,
                        },
                    },

                    palettes: {
                        paletteId1: {
                            colors: {
                                0: {
                                    color: 'red',
                                    width: 1,
                                    style: 0,
                                },
                                1: {
                                    color: 'blue',
                                    width: 3,
                                    style: 1,
                                },
                            },
                        },
                    },

                    styles:
                    {
                        plot_0: {
                            linestyle: 0,
                            visible: true,
                            linewidth: 1,
                            plottype: 2,
                            trackPrice: true,
                            color: 'blue'
                        },
                        plot_1: {
                            linestyle: 1,
                            visible: true,
                            linewidth: 2,
                            plottype: 2,
                            trackPrice: true,
                            color: 'red'
                        },
                    },
                    precision: 4,
                    inputs: {}
                },
                styles:
                {
                    plot_0:
                    {
                        title: 'First plot',
                        histogramBase: 0,
                    },
                    plot_1:
                    {
                        title: 'Second plot',
                        histogramBase: 0,
                    },
                },
                inputs: [],
                format: {
                    type: 'price',
                    precision: 4,
                },
            },
            constructor: function() {
                this.main = function(context, inputCallback) {
                    this._context = context;
                    this._input = inputCallback;

                    var value = Math.random() * 200 - 100;
                    var colorIndex = value > 0 ? 0 : 1;

                    return [0, value, colorIndex];
                }
            }
        }
    ]);
},
/* Within the Widget constructor options */
custom_indicators_getter: PineJS => {
    return Promise.resolve<CustomIndicator[]>([

        /* Complex filled areas */
        {
            name: 'Complex Filled Areas',
            metainfo: {
                _metainfoVersion: 51,
                id: 'ComplexFilledAreas@tv-basicstudies-1' as RawStudyMetaInfoId,
                description: 'Complex Filled Areas',
                shortDescription: 'Complex Filled Areas',
                is_price_study: false,
                isCustomIndicator: true,
                plots: [
                    {
                        id: 'plot_0',
                        type: StudyPlotType.Line,
                    },
                    {
                        id: 'plot_1',
                        type: StudyPlotType.Line,
                    },
                    {
                        id: 'plot_2',
                        type: StudyPlotType.Colorer,
                        target: 'filledAreaId1',
                        palette: 'paletteId1',
                    },
                ],

                filledAreas: [
                    {
                        id: 'filledAreaId1',
                        objAId: 'plot_0',
                        objBId: 'plot_1',
                        title: 'Filled area between first and second plot',
                        type: FilledAreaType.TypePlots,
                        palette: 'paletteId1',
                    },
                ],

                palettes: {
                    paletteId1: {
                        valToIndex: {
                            0: 0,
                            1: 1,
                        },
                        colors: {
                            0: {
                                name: 'First color',
                            },
                            1: {
                                name: 'Second color',
                            },
                        },
                    },
                },
                defaults: {
                    filledAreasStyle: {
                        filledAreaId1: {
                            color: 'yellow',
                            visible: true,
                            transparency: 40,
                        },
                    },

                    palettes: {
                        paletteId1: {
                            colors: {
                                0: {
                                    color: 'red',
                                    width: 1,
                                    style: 0,
                                },
                                1: {
                                    color: 'blue',
                                    width: 3,
                                    style: 1,
                                },
                            },
                        },
                    },

                    styles: {
                        plot_0: {
                            linestyle: 0,
                            visible: true,
                            linewidth: 1,
                            plottype: 2 as StudyLinePlotPreferences['plottype'],
                            trackPrice: true,
                            color: 'blue',
                        },
                        plot_1: {
                            linestyle: 1,
                            visible: true,
                            linewidth: 2,
                            plottype: 2 as StudyLinePlotPreferences['plottype'],
                            trackPrice: true,
                            color: 'red',
                        },
                    },
                    precision: 4,
                    inputs: {},
                },
                styles: {
                    plot_0: {
                        title: 'First plot',
                        histogramBase: 0,
                    },
                    plot_1: {
                        title: 'Second plot',
                        histogramBase: 0,
                    },
                },
                inputs: [],
                format: {
                    type: 'price',
                    precision: 4,
                },
            },
            constructor: function (
                this: LibraryPineStudy<IPineStudyResult>
            ) {
                this.main = function (context, inputCallback) {
                    this._context = context;
                    this._input = inputCallback;

                    var value = Math.random() * 200 - 100;
                    var colorIndex = value > 0 ? 0 : 1;

                    return [0, value, colorIndex];
                };
            },
        },
    ]);
},
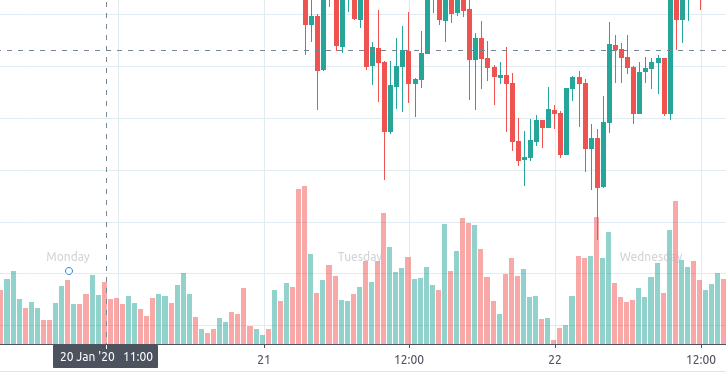
Advanced Shapes Use
- JavaScript
- TypeScript
custom_indicators_getter: function(PineJS) {
    return Promise.resolve([
        {
            name: 'Mondays',
            metainfo: {
                _metainfoVersion: 51,
                defaults: {
                    styles: {
                        plot_0: {
                            color: '#FF5252',
                            textColor: '#2196F3',
                            plottype: 'shape_circle',
                            location: 'Bottom',
                            visible: true
                        }
                    },
                    inputs: {}
                },
                plots: [
                    {
                        id: 'plot_0',
                        type: 'shapes'
                    }
                ],
                styles: {
                    plot_0: {
                        isHidden: false,
                        location: 'Bottom',
                        text: 'Monday',
                        title: 'Shapes'
                    }
                },
                description: 'Mondays',
                shortDescription: 'Mondays',
                is_price_study: true,
                inputs: [],
                id: 'Mondays@tv-basicstudies-1',
                format: {
                    type: 'inherit',
                },
            },
            constructor: function() {
                this.main = function(context, inputCallback) {
                    // If we don't have a time, then we cannot determine the day of week
                    if (isNaN(context.symbol.time)) {
                        return [NaN]
                    }

                    // Check if the day of the week is Monday
                    const dayofweek = PineJS.Std.dayofweek(context);
                    const shouldBeShapeVisible = dayofweek === 2;
                    // 1 is plot value, it'll be displayed in legend of the indicator
                    // NaN means that there is no value for that plot and shape should be hidden for that bar
                    const plotValue = shouldBeShapeVisible ? 1 : NaN;
                    return [plotValue];
                }
            }
        },
    ]);
},
/* Within the Widget constructor options */
custom_indicators_getter: PineJS => {
    return Promise.resolve<CustomIndicator[]>([

       /* Advanced Shapes use */
        {
            name: 'Mondays',
            metainfo: {
                _metainfoVersion: 51,
                defaults: {
                    styles: {
                        plot_0: {
                            color: '#FF5252',
                            textColor: '#2196F3',
                            plottype: 'shape_circle' as StudyShapesPlotPreferences['plottype'],
                            location: 'Bottom' as StudyShapesPlotPreferences['location'],
                            visible: true
                        }
                    },
                    inputs: {},
                },
                plots: [
                    {
                        id: 'plot_0',
                        type: StudyPlotType.Shapes,
                    },
                ],
                styles: {
                    plot_0: {
                        isHidden: false,
                        location: 'Bottom' as StudyShapesPlotPreferences['location'],
                        plottype: 'shape_circle' as StudyShapesPlotPreferences['plottype'],
                        text: 'Monday',
                        title: 'Shapes',
                    },
                },
                description: 'Mondays',
                shortDescription: 'Mondays',
                is_price_study: true,
                inputs: [],
                id: 'Mondays@tv-basicstudies-1' as RawStudyMetaInfoId,
                format: {
                    type: 'inherit',
                },
            },
            constructor: function (
                this: LibraryPineStudy<IPineStudyResult>
            ) {
                this.main = function (context, inputCallback) {
                    // If we don't have a time, then we cannot determine the day of week
                    if (isNaN(context.symbol.time)) {
                        return [NaN]
                    }

                    // Check if the day of the week is Monday
                    const dayofweek = PineJS.Std.dayofweek(context);
                    const shouldBeShapeVisible = dayofweek === 2;
                    // 1 is plot value, it'll be displayed in legend of the indicator
                    // NaN means that there is no value for that plot and shape should be hidden for that bar
                    const plotValue = shouldBeShapeVisible ? 1 : NaN;
                    return [plotValue];
                };
            },
        },
    ]);
},
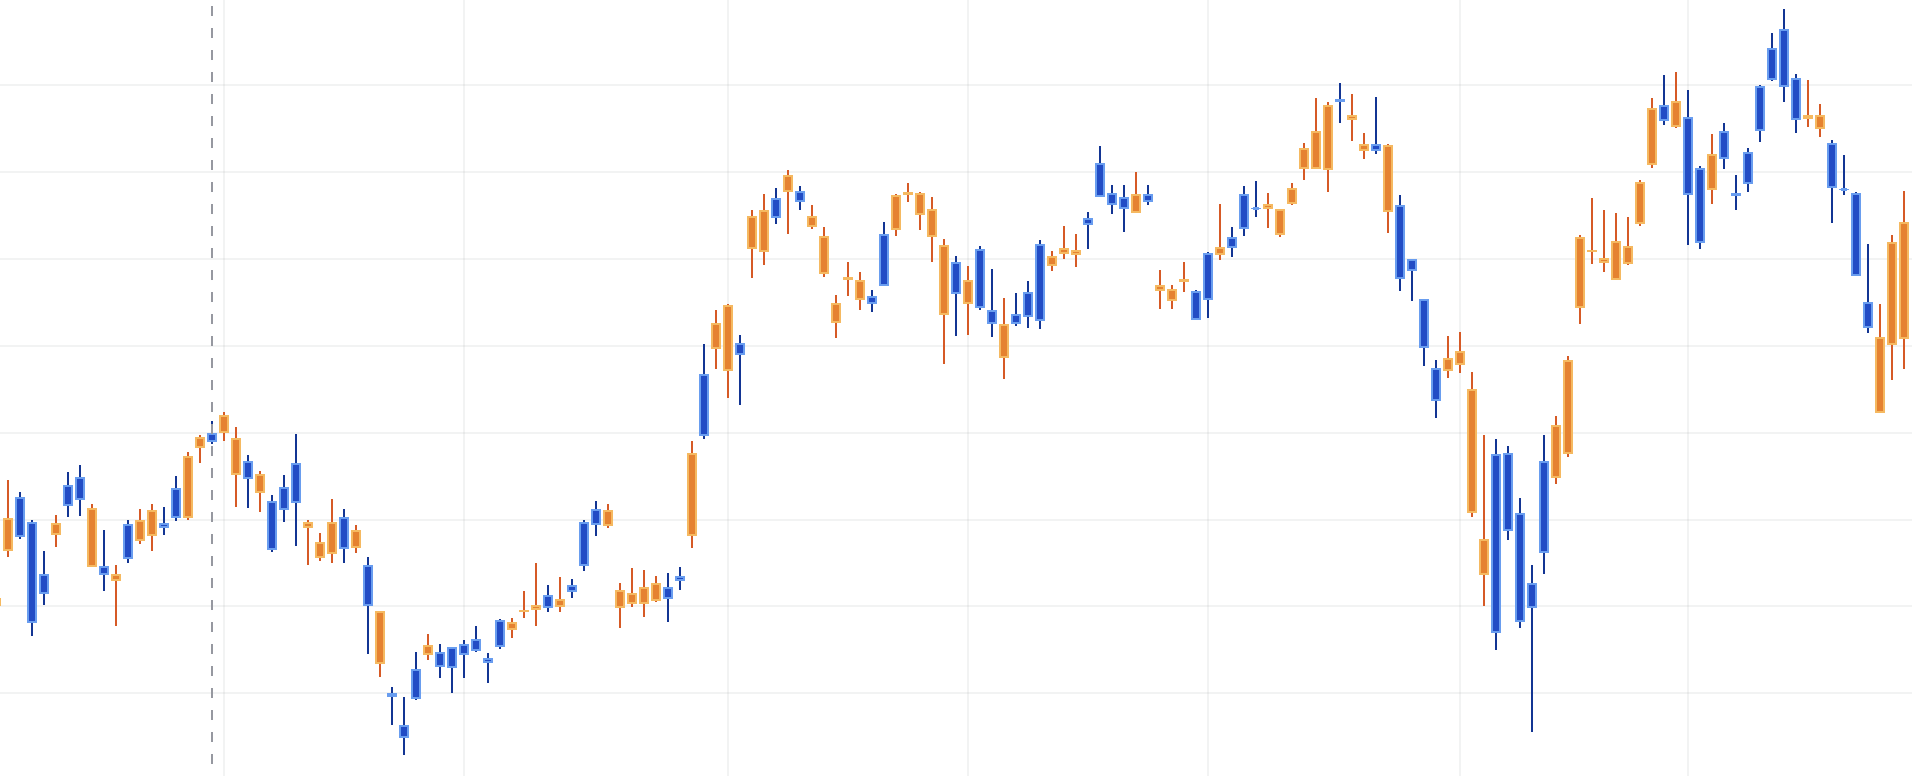
Advanced Colouring Candles
- JavaScript
- TypeScript
custom_indicators_getter: function(PineJS) {
    return Promise.resolve([
        {
            name: 'Advanced Coloring Candles',
            metainfo: {
                _metainfoVersion: 51,

                id: 'advancedcolouringcandles@tv-basicstudies-1',
                name: 'Advanced Coloring Candles',
                description: 'Advanced Coloring Candles',
                shortDescription: 'Advanced Coloring Candles',

                isCustomIndicator: true,

                is_price_study: false, // whether the study should appear on the main series pane.
                linkedToSeries: true, // whether the study price scale should be the same as the main series one.

                format: {
                    type: 'price',
                    precision: 2,
                },

                plots: [
                    {
                        id: 'plot_open',
                        type: 'ohlc_open',
                        target: 'plot_candle',
                    },
                    {
                        id: 'plot_high',
                        type: 'ohlc_high',
                        target: 'plot_candle',
                    },
                    {
                        id: 'plot_low',
                        type: 'ohlc_low',
                        target: 'plot_candle',
                    },
                    {
                        id: 'plot_close',
                        type: 'ohlc_close',
                        target: 'plot_candle',
                    },
                    {
                        id: 'plot_bar_color',
                        type: 'ohlc_colorer',
                        palette: 'palette_bar',
                        target: 'plot_candle',
                    },
                    {
                        id: 'plot_wick_color',
                        type: 'wick_colorer',
                        palette: 'palette_wick',
                        target: 'plot_candle',
                    },
                    {
                        id: 'plot_border_color',
                        type: 'border_colorer',
                        palette: 'palette_border',
                        target: 'plot_candle',
                    },
                ],

                palettes: {
                    palette_bar: {
                        colors: [{ name: 'Colour One' }, { name: 'Colour Two' }],

                        valToIndex: {
                            0: 0,
                            1: 1,
                        },
                    },
                    palette_wick: {
                        colors: [{ name: 'Colour One' }, { name: 'Colour Two' }],

                        valToIndex: {
                            0: 0,
                            1: 1,
                        },
                    },
                    palette_border: {
                        colors: [{ name: 'Colour One' }, { name: 'Colour Two' }],

                        valToIndex: {
                            0: 0,
                            1: 1,
                        },
                    },
                },

                ohlcPlots: {
                    plot_candle: {
                        title: 'Candles',
                    },
                },

                defaults: {
                    ohlcPlots: {
                        plot_candle: {
                            borderColor: '#000000',
                            color: '#000000',
                            drawBorder: true,
                            drawWick: true,
                            plottype: 'ohlc_candles',
                            visible: true,
                            wickColor: '#000000',
                        },
                    },

                    palettes: {
                        palette_bar: {
                            colors: [
                                { color: '#1948CC', width: 1, style: 0 },
                                { color: '#F47D02', width: 1, style: 0 },
                            ],
                        },
                        palette_wick: {
                            colors: [
                                { color: '#0C3299', },
                                { color: '#E65000', },
                            ],
                        },
                        palette_border: {
                            colors: [
                                { color: '#5B9CF6', },
                                { color: '#FFB74D', },
                            ],
                        },
                    },

                    precision: 2,
                    inputs: {},
                },
                styles: {},
                inputs: [],
            },
            constructor: function () {
                this.main = function (context, inputCallback) {
                    this._context = context;
                    this._input = inputCallback;

                    this._context.select_sym(0);

                    const o = PineJS.Std.open(this._context);
                    const h = PineJS.Std.high(this._context);
                    const l = PineJS.Std.low(this._context);
                    const c = PineJS.Std.close(this._context);

                    // Color is determined randomly
                    const colour = Math.round(Math.random());
                    return [o, h, l, c, colour /*bar*/, colour /*wick*/, colour /*border*/];
                };
            },
        },
    ]);
},
/* Within the Widget constructor options */
custom_indicators_getter: PineJS => {
    return Promise.resolve<CustomIndicator[]>([

       /* Advanced Colouring Candles */
        {
            name: 'Advanced Coloring Candles',
            metainfo: {
                _metainfoVersion: 51,

                id: 'advancedcolouringcandles@tv-basicstudies-1' as RawStudyMetaInfoId,
                name: 'Advanced Coloring Candles',
                description: 'Advanced Coloring Candles',
                shortDescription: 'Advanced Coloring Candles',

                isCustomIndicator: true,

                is_price_study: false, // whether the study should appear on the main series pane.
                linkedToSeries: true, // whether the study price scale should be the same as the main series one.

                format: {
                    type: 'price',
                    precision: 2,
                },

                plots: [
                    {
                        id: 'plot_open',
                        type: StudyPlotType.OhlcOpen,
                        target: 'plot_candle',
                    },
                    {
                        id: 'plot_high',
                        type: StudyPlotType.OhlcHigh,
                        target: 'plot_candle',
                    },
                    {
                        id: 'plot_low',
                        type: StudyPlotType.OhlcLow,
                        target: 'plot_candle',
                    },
                    {
                        id: 'plot_close',
                        type: StudyPlotType.OhlcClose,
                        target: 'plot_candle',
                    },
                    {
                        id: 'plot_bar_color',
                        type: StudyPlotType.OhlcColorer,
                        palette: 'palette_bar',
                        target: 'plot_candle',
                    },
                    {
                        id: 'plot_wick_color',
                        type: StudyPlotType.CandleWickColorer,
                        palette: 'palette_wick',
                        target: 'plot_candle',
                    },
                    {
                        id: 'plot_border_color',
                        type: StudyPlotType.CandleBorderColorer,
                        palette: 'palette_border',
                        target: 'plot_candle',
                    },
                ],

                palettes: {
                    palette_bar: {
                        colors: [{ name: 'Colour One' }, { name: 'Colour Two' }],

                        valToIndex: {
                            0: 0,
                            1: 1,
                        },
                    },
                    palette_wick: {
                        colors: [{ name: 'Colour One' }, { name: 'Colour Two' }],

                        valToIndex: {
                            0: 0,
                            1: 1,
                        },
                    },
                    palette_border: {
                        colors: [{ name: 'Colour One' }, { name: 'Colour Two' }],

                        valToIndex: {
                            0: 0,
                            1: 1,
                        },
                    },
                },

                ohlcPlots: {
                    plot_candle: {
                        title: 'Candles',
                    },
                },

                defaults: {
                    ohlcPlots: {
                        plot_candle: {
                            borderColor: '#000000',
                            color: '#000000',
                            drawBorder: true,
                            drawWick: true,
                            plottype: OhlcStudyPlotStyle.OhlcCandles,
                            visible: true,
                            wickColor: '#000000',
                        },
                    },

                    palettes: {
                        palette_bar: {
                            colors: [
                                { color: '#1948CC', width: 1, style: 0 },
                                { color: '#F47D02', width: 1, style: 0 },
                            ],
                        },
                        palette_wick: {
                            colors: [{ color: '#0C3299' }, { color: '#E65000' }],
                        },
                        palette_border: {
                            colors: [{ color: '#5B9CF6' }, { color: '#FFB74D' }],
                        },
                    },

                    precision: 2,
                    inputs: {},
                },
                styles: {},
                inputs: [],
            },
            constructor: function (
                this: LibraryPineStudy<IPineStudyResult>
            ) {
                this.main = function (context, inputCallback) {
                    this._context = context;
                    this._input = inputCallback;

                    this._context.select_sym(0);

                    const o = PineJS.Std.open(this._context);
                    const h = PineJS.Std.high(this._context);
                    const l = PineJS.Std.low(this._context);
                    const c = PineJS.Std.close(this._context);

                    // Color is determined randomly
                    const colour = Math.round(Math.random());
                    return [
                        o,
                        h,
                        l,
                        c,
                        colour /*bar*/,
                        colour /*wick*/,
                        colour /*border*/,
                    ];
                };
            },
        },
    ]);
},