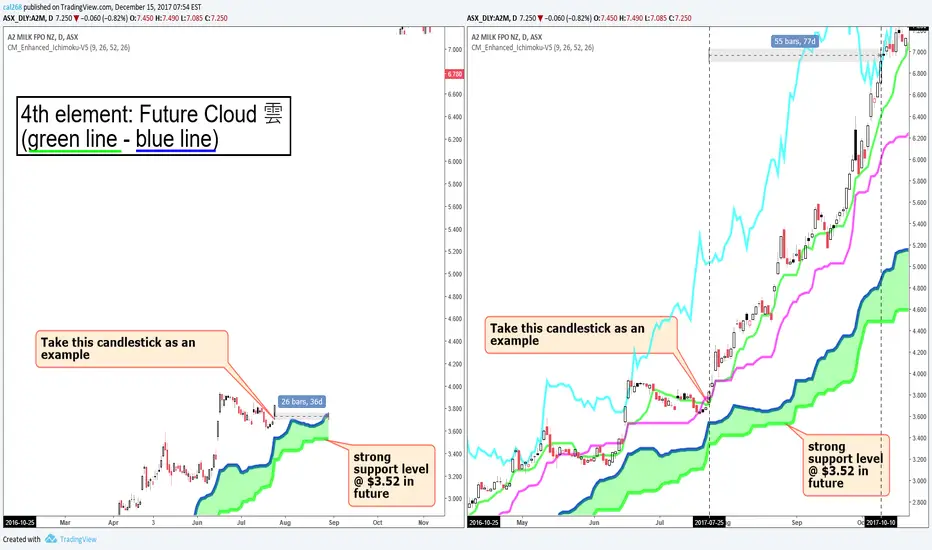
Future cloud is shifted forward 26 periods
I hide the right part of the price actions on the left chart to show you the future cloud ends 26 days periods forward. Please note that some brokers' Ichimoku indicator doesn't include this function.
By adding the 1st, 2nd & 3rd elements into the right chart, we have a complete Ichimoku chart.
As you see the Tenkan-sen & Kijun-sen overlap nearly 5 days after 2017-07-25. Tenkan-sen finally takes off. Also, the chinkou span is above price.
These are the evidences to show A2M is trending upward BULLISH.
Until 2017-10-10, chinkou span stuck in the price.
By using this strategy, A2M rose from $3.8 to $6.9 in 55 bars
免責聲明
這些資訊和出版物並不意味著也不構成TradingView提供或認可的金融、投資、交易或其他類型的意見或建議。請在使用條款閱讀更多資訊。
