Liquidity Spectrum Visualizer [BigBeluga]🔵 OVERVIEW
The Liquidity Spectrum Visualizer is a smart tool for exposing hidden liquidity zones by combining a dynamic volume profile, clear liquidity levels, and intuitive volume bubbles directly on your price chart. It shows you exactly where significant volume is clustering inside your chosen lookback period — highlighting where big market participants may be defending price or planning breakouts.
🔵 CONCEPTS
Volume Profile Bins: Breaks your custom lookback range into 100 fine price bins, calculating total volume per bin to create a precise vertical liquidity histogram.
Liquidity Levels: Bins with high relative volume automatically plot as horizontal lines — thicker and brighter lines signal stronger liquidity concentrations.
Dynamic Coloring: Profile bins and liquidity levels adjust their colors live based on whether current price is trading above (support) or below (resistance).
Volume Bubbles: Each candle displays a bubble at its HLC3 price —
- The bubble’s size shows relative candle volume.
- Its color gradient indicates bullish or bearish volume: greenish for bullish candles, orange for bearish.
Bubble Labels: The largest bubbles automatically label the actual volume amount, revealing big hidden flows.
Range Box High/Low: Marks the absolute swing high and low inside the lookback window, clearly framing the active liquidity zone.
🔵 FEATURES
Smart, auto-scaled volume profile up to 200 candles (or custom).
Liquidity levels with dynamic thickness and color based on real-time volume.
Bubbles sized and colored to show both volume magnitude and bullish/bearish bias.
Largest bubbles labeled for fast detection of high-impact bars.
High and low price labels clearly show the analyzed range.
Toggle Volume Profile, Liquidity Levels, and Bubbles independently.
🔵 HOW TO USE
Watch for thick, bright liquidity levels — these zones mark where large orders or stop clusters are likely hidden.
Use dynamic coloring: if price is above a level, it’s support; if below, it’s resistance.
Pay special attention to big bubbles: these mark sudden spikes in traded volume and can signal absorption, traps, breakouts or significant price levels.
Combine with your existing confluence tools to confirm breakouts or fakeouts around visible liquidity clusters.
🔵 CONCLUSION
The Liquidity Spectrum Visualizer transforms hidden order flow into an intuitive, color-coded map. You see at a glance where price is absorbing, consolidating, or ready to break — all powered by real-time volume behavior and smart visuals. It’s a must-have tool for traders who want to read liquidity and react ahead of the crowd.
指標和策略

Pivot Channel LevelsPivot Channel Levels
Indicator Description
“Pivot Channel Levels” is an advanced technical analysis tool that identifies key price pivots (highs and lows) and creates dynamic support and resistance levels based on the wicks of candles at these points (or bodies if wicks are minimal). The indicator analyzes the volume at the time of a pivot’s formation, displaying its value and percentage change relative to the volume’s simple moving average (SMA).
It does not generate buy/sell signals but provides a clear visualization of market structure, helping traders identify potential price reaction zones and assess the strength of market movements.
Why Are Wicks Important?
Candle wicks at price pivots indicate significant market reactions in key areas. Depending on the context, they may signal rejection, testing, or absorption of a support or resistance level. Long wicks often appear where large players are active, and the marked zones are frequently retested. The indicator allows for quick identification and observation of their impact on future price action.
Why Use It?
- Precise Support and Resistance Levels: The indicator draws price channels based on candle wicks at pivots (or bodies if wicks are absent), enabling better identification of zones where price may react.
- Volume Analysis: It shows how the volume at a pivot differs from the average, indicating potential activity by large players or key market moments.
- Visual Clarity: Colored lines, channel fills, and clear labels facilitate quick chart analysis, even on short timeframes.
- Flexibility: Adjustable pivot length, volume average, and label colors allow customization to various trading strategies.
How It Works
- Pivot Detection: Automatically identifies local highs and lows based on the “Pivot Length” parameter (default: 20 candles). This means a pivot appears on the chart with a 20-candle delay. Reducing this value allows faster pivot detection (after fewer candles), increasing their number but potentially generating more noise.
- Channel Creation: Draws support and resistance levels based on the wicks of candles at pivot points (or bodies if wicks are minimal) with a delay to confirm zones. A pivot channel is drawn until the next pivot is identified, but if not previously broken, it remains valid as active support or resistance.
- Volume Analysis: Displays the volume at the pivot’s formation and its percentage change relative to the volume’s SMA.
- Visualization: Pivot and channel levels are shown as lines with fills, and labels display volume and its deviation from the average.
Trading Applications
- Swing Trading: Use pivot levels and channels to identify price reversal points or consolidation zones.
- Scalping: Monitor price reactions to channels on short timeframes, especially with high volume.
- Faster Pivot Identification: Switch to a lower timeframe (e.g., from H1 to M15) to identify pivots more quickly, allowing earlier reactions to price changes.
- Market Context Analysis: High volume at pivots may indicate significant levels likely to be retested.
- Combining with Other Tools: The indicator pairs well with Fibonacci retracement, supply/demand zones, or oscillators like RSI.
Settings and Customization
- Pivot Length: Determines how many candles back and forward are analyzed to detect pivots (default: 20). A smaller value increases sensitivity, a larger one enhances stability.
- Volume Average: Length of the SMA for volume (default: 20). Adjust to better reflect market characteristics.
- Label Colors: Choose colors for bullish and bearish pivot labels to match your chart style.
Usage Examples
- Identifying Key Zones: If the price approaches a pivot level with high volume (e.g., +50% relative to SMA), it may signal strong support or resistance.
- Breakout Confirmation: A channel breakout with high volume can indicate trend continuation.
- Price Reaction Analysis: Long wicks at pivots with high volume may signal level rejection by large players.
Notes for Users
- The indicator performs best on highly liquid markets (e.g., Forex, indices, cryptocurrencies).
- On short timeframes (e.g., M1, M5), it may generate more noise—adjust “Pivot Length” to suit your needs.
- Consider combining with other indicators to confirm signals derived from pivot and volume analysis.

Std.dev [AY¹]İşte TradingView için uygun açıklama metni:
Std.dev - Extended Range Deviation Indicator
This indicator calculates and displays standard deviation levels based on a custom session's high and low range, with lines extending until the next session start.
Key Features:
Custom Session Definition: Set your preferred session time (default: 09:00-11:30)
Extended Lines: Deviation lines extend from session end until next day's session start (09:00)
Flexible Deviation Types: Choose between full deviations (1.0, 2.0, 3.0...) or half deviations (0.5, 1.0, 1.5, 2.0...)
Visual Differentiation: Half deviation levels are displayed with dashed lines for easy identification
Anchor Point Options: Calculate deviations based on wicks or candle bodies
Session Visualization: Optional session range boxes and vertical start/end lines
Equilibrium Line: Optional mid-point line between session high and low
How it Works:
Identifies the specified session period each day
Captures the highest and lowest prices during that session
Calculates the range (high - low)
Draws multiple deviation levels above and below the range
Extends all levels until the next session begins
Use Cases:
Support and resistance level identification
Price target projections
Range-based trading strategies
Market structure analysis
Settings:
Session time configuration
Number of deviation levels (1-10)
Line styles and colors
Show/hide session boxes and labels
Customizable anchor points (wicks vs bodies)
The indicator preserves historical levels, allowing traders to analyze multiple sessions simultaneously for comprehensive market structure analysis.

Fibonacci Retracement levels Automatically D/W/MIndicator Description: Fibonacci Retracement levels Automatically
Fibonacci retracement levels based on the day, week, month High Low range and Fibonacci retracement levels draws automatically .This Pine Script indicator is designed to plot Fibonacci retracement levels based on the high and low prices of a user-selected timeframe (Daily, Weekly, or Monthly). It identifies bullish or bearish candles in the chosen timeframe, draws key price levels, and overlays Fibonacci retracement lines and semi-transparent colored boxes to highlight potential support and resistance zones. The indicator dynamically updates with each new period and extends lines, labels, and boxes to the current bar for real-time visualization. Key Features
1. Timeframe Selection: Users can choose the timeframe for analysis: Daily, Weekly, or Monthly via an input dropdown. The indicator retrieves the open, high, low, and close prices for the selected timeframe using `request.security`.
2. High and Low Tracking : Tracks the highest high and lowest low within the selected timeframe. Stores these values and their corresponding bar indices in arrays (`whigh`, `wlow`, `whighIdx`,`wlowIdx`). Limits the array size to the most recent period to optimize performance.
3. Bullish and Bearish Candle Detection : Identifies whether the previous period’s candle is bullish (`close > open`) or bearish (`close < open`). Uses this to determine the direction for Fibonacci retracement calculations. Bullish candle: Fibonacci levels are drawn from low to high
Bearish candle: Fibonacci levels are drawn from high to low
4. Fibonacci Retracement Levels : Plots Fibonacci levels at 0.236, 0.382, 0.5, 0.618, and 0.786 between the high and low of the period. For bullish candles, levels are calculated from the low (support) to the high (resistance). For bearish candles, levels are calculated from the high (resistance) to the low (support). Each Fibonacci level is drawn as a horizontal line with a unique color:
- 0.236: Blue
- 0.382: Purple
- 0.5: Yellow
- 0.618: Teal
- 0.786: Fuchsia
5. Visual Elements: - High/Low Lines and Labels: Draws a red line and label for the previous period’s high. Draws a green line and label for the previous period’s low. Fibonacci Lines and Labels: Each Fibonacci level has a horizontal line and a label displaying the ratio.
Colored Boxes: Semi-transparent boxes are drawn between consecutive Fibonacci levels (including high and low) to highlight zones.
6. Dynamic Updates:
- At the start of a new period (e.g., new week for Weekly timeframe), the indicator:
- Clears previous Fibonacci lines, labels, and boxes.
- Recalculates the high and low for the new period.
- Redraws lines, labels, and boxes based on the new data.
- Extends all lines, labels, and boxes to the current bar index for real-time tracking.
7. Performance Optimization:
- Deletes old lines, labels, and boxes to prevent clutter.
- Limits the storage of highs and lows to the most recent period.
How It Works
1. Initialization: Defines variables for tracking bullish/bearish candles, lines, labels, and arrays for Fibonacci levels and boxes. Sets up color arrays for Fibonacci lines and boxes with distinct, semi-transparent colors.
2. Data Collection: Fetches the previous period’s OHLC (open, high, low, close) using `request.security`. Detects new periods (e.g., new week or month) using `ta.change(time(tf))`.
3. Fibonacci Calculation: On a new period, stores the high and low prices and their bar indices.
- Identifies the maximum high and minimum low from the stored data. - Calculates Fibonacci levels based on the range (`maxHigh - minLow`) and the direction (bullish or bearish).
4. Drawing:
- Draws high/low lines and labels at the identified price levels. Plots Fibonacci retracement lines and labels for each ratio. Creates semi-transparent boxes between Fibonacci levels to visually distinguish zones.
5. Updates:
- Extends all lines, labels, and boxes to the current bar index when a new period is detected. Clears old Fibonacci elements to avoid overlap and ensure clarity.
Usage
- Purpose: This indicator is useful for traders who use Fibonacci retracement levels to identify potential support and resistance zones in financial markets.
- Application:
- Select the desired timeframe (Daily, Weekly, Monthly) via the input settings.
- The indicator automatically plots the previous period’s high/low and Fibonacci levels on the chart.
- Use the labeled Fibonacci levels and colored boxes to identify key price zones for trading decisions.
- Customization:
- Modify the `timeframe` input to switch between Daily, Weekly, or Monthly analysis.
- Adjust the `fibLineColors` and `fibFillColors` arrays to change the visual appearance of lines and boxes.
- The indicator is designed for use on TradingView with Pine Script.
- The maximum array size for highs/lows is limited to 1 period in this version (can be adjusted by modifying the `array.shift` logic).
- The indicator dynamically updates with each new period, ensuring real-time relevance.
This indicator make educational purpose use only

Inflection PointInflection Point - The Adaptive Confluence Reversal Engine
This is not just another peak and valley indicator; it is a complete and total reimagining of how market turning points are detected, qualified, and acted upon. Born from the foundational concepts explored in systems like my earlier creation, DAFE - Turning Point, Inflection Point is a ground-up engineering feat designed for the modern trader. It moves beyond static rules and simple pattern recognition into the realm of dynamic, multi-factor confluence analysis and adaptive machine learning.
Where other indicators provide a guess, Inflection Point provides a probability. It meticulously analyzes the market's deepest currents—momentum, exhaustion, and reversal velocity—and fuses them into a single, unified "Confluence Score." This is not a simple combination of indicators; it is an intelligent, weighted system where each component works in concert, creating an analytical engine that is orders of magnitude more sophisticated and reliable than any standard reversal tool.
Furthermore, Inflection Point learns. Through its advanced Adaptive Learning Engine, it constantly monitors its own performance, adjusting its confidence and selectivity in real-time based on its recent success rate. This allows it to adapt its behavior to any security, on any timeframe, with remarkable success.
Theoretical Foundation - Confluence Core
Inflection Point's predictive power does not come from a single, magical formula. It comes from the intelligent synthesis of three critical market phenomena, weighted and scored in real-time to generate a single, high-conviction probability rating.
1. Factor One: Pre-Reversal Momentum State (RSI Analysis)
Instead of reacting to a simple RSI cross, Inflection Point proactively scans for the build-up of momentum that precedes a reversal.
• Formulaic Concept: It measures the highest RSI value over a lookback period for peaks and the lowest RSI for valleys. A signal is only considered valid if significant momentum has been established before the turn, indicating a stretched market condition ripe for reversal.
• Asymmetric Sophistication: The engine uses different, optimized thresholds for bull and bear momentum, recognizing that markets often fall faster than they rise.
2. Factor Two: Volatility Exhaustion (Bollinger Band Analysis)
A true reversal often occurs when price makes a final, exhaustive push into unsustainable territory.
• Formulaic Concept: The engine detects when price has significantly pierced the outer Bollinger Bands. This is not just a touch, but a statistical deviation from the mean that signals volatility exhaustion, where the energy for the current move is likely depleted.
3. Factor Three: Reversal Strength (Rate of Change Analysis)
The character of a reversal matters. A sharp, decisive turn is more significant than a slow, meandering one.
• Formulaic Concept: Using a short-term Rate of Change (ROC), the engine measures the velocity of the reversal itself. A higher ROC score adds significant weight to the final probability, confirming that the new direction has conviction.
4. The Final Calculation: The Adaptive Learning Engine
This is the system's "brain." It maintains a history of its past signals and calculates its real-time win rate. This hitRate is then used to generate an adaptiveMultiplier.
• Self-Correction: In "Quality Control" mode, a high win rate makes the indicator more selective, demanding a higher probability score to issue a signal, thereby protecting streaks. A lower win rate makes it slightly less selective to ensure it continues learning from new market conditions.
• The result is a system that is not static, but a living, breathing tool that adapts its personality to the unique rhythm of any chart.
Why Inflection Point is a Paradigm Shift
Inflection Point is fundamentally different from other reversal indicators for three key reasons:
Confluence Over Isolation: Standard indicators look at one thing (e.g., RSI > 70). Inflection Point simultaneously analyzes momentum, volatility, and velocity, understanding that true reversals are a product of multiple converging factors. It answers not just "if," but "why" a reversal is likely.
Probabilistic Over Binary: Other tools give you a simple "yes" or "no." Inflection Point provides a probability score from 0-100, allowing you to gauge the conviction of every potential signal. This empowers you to differentiate between a weak setup and an A+ opportunity.
Adaptive Over Static: Every other indicator uses the same rules forever. Inflection Point's Adaptive Engine means it is constantly refining its own logic based on what is actually working in the current market, on the specific asset you are trading. It is tailored to the now.
The Inputs Menu - Your Command Center
Every setting is a lever of control, allowing you to tune the engine to your precise trading style and market focus.
🧠 Neural Core Engine
Analysis Depth: This is the primary lookback for the Bollinger Band and other core calculations. A shorter depth makes the indicator faster and more sensitive, ideal for scalping. A longer depth makes it slower and more stable, ideal for swing trading.
Minimum Probability %: This is your master signal filter. It sets the minimum Confluence Score required to plot a signal. Higher values (85-95) will give you only the highest-conviction A+ setups. Lower values (70-80) will show more potential opportunities.
🤖 Adaptive Neural Learning
Enable Adaptive Learning Engine: Toggles the entire learning system. Disabling it will make the indicator's logic static.
Peak/Valley Success Threshold (ATR): This defines what constitutes a "successful" trade for the learning engine. A value of 1.5 means price must move 1.5x the ATR in your favor for the signal to be marked as a win. Adjust this to match your personal take-profit strategy.
Adaptive Mode: This dictates how the engine uses its hitRate. "Quality Control" is recommended for its intelligent filtering. "Aggressive" will always boost signal scores, useful for finding more setups in a known, trending environment.
Asymmetric Balance: Allows you to apply a "boost" to either peak (short) or valley (long) signals. If you find the market you're trading has stronger long reversals, you can increase the "Valley Signal Boost" to catch them more effectively.
🛡️ Elite Filters
Market Noise Filter: An exceptional tool for avoiding choppy markets. It counts the number of directional changes in the last 5 bars. If the market is whipping back and forth too much, it will block the signal. Lower the "Max Direction Changes" to be extremely selective.
Volume Filter: Requires signal confirmation from a significant volume spike. The "Volume Multiplier" dictates how large this spike must be (e.g., 1.2 = 20% above average volume). This is invaluable for filtering out low-conviction moves in stocks and crypto.
The Dashboard - Your Analytical Co-Pilot
The dashboard is not just a set of numbers; it is a holistic overview of the market's health and the engine's current state.
Unified AI Score: This section provides the most critical, at-a-glance information. "Total Score" is the current probability reading, while "Quality" gives you a human-readable interpretation. "Win Rate" shows the real-time performance of the Adaptive Engine.
Order Flow (OFPI): This measures the "weight" of money behind recent price moves by analyzing price change relative to volume. A high positive OFPI suggests strong buying pressure, while a high negative value suggests strong selling pressure. It gives you a peek into the market's underlying flow.
Component Analysis: This allows you to see the individual "Peak" and "Valley" confidence scores before they are filtered, giving you insight into building momentum before a signal forms.
Market Structure: This panel assesses the broader environment. "HTF Trend" tells you the direction of the larger trend (based on EMAs), while "Vol Regime" tells you if the market is in a high, medium, or low volatility state. Use this to align your signals with the broader market context.
Filter & Engine Statistics: Available on the "Large" dashboard, this provides deep insight into how many signals are being blocked by your filters and the current status of the Adaptive Engine's multiplier.
The Visual Interface - A Symphony of Data
Every visual element on the chart is designed for instant interpretation and insight.
Signal Markers: Simple, clean triangles mark the exact bar of a valid signal. A box is drawn around the high/low of the signal bar to highlight the precise point of inflection.
Dynamic Support/Resistance Zones: These are the glowing lines on your chart. They are not static lines; they are dynamic levels that represent the current battlefield between buyers and sellers.
Cyber Cyan (Valley Blue): This is the current Support Zone. This is the price level the market is currently trying to defend.
Neural Pink (Peak Red): This is the current Resistance Zone. This is the price level the market is currently trying to break through.
Grey (Next Level): This line is a projection, based on the current momentum and the size of the S/R range, of where the next major level of conflict will likely be. It acts as a potential price target.
Development & Philosophy
Inflection Point was not assembled; it was engineered. It represents hundreds of hours of research into market dynamics, statistical analysis, and machine learning principles. The goal was to create a tool that moves beyond the limitations of traditional technical analysis, which often fails in modern, algorithm-driven markets. By building a system based on multi-factor confluence and self-adaptive logic, Inflection Point provides a quantifiable, statistical edge that is simply unattainable with simpler tools. This is the result of a relentless pursuit of a better, more intelligent way to trade.
Universal Applicability
The principles of momentum, exhaustion, and velocity are universal to all freely traded markets. Because of its adaptive core and robust filtering options, Inflection Point has proven to be exceptionally effective on any security (stocks, crypto, forex, indices, futures) and on any timeframe (from 1-minute scalping charts to daily swing trading charts).
" Markets are constantly in a state of uncertainty and flux and money is made by discounting the obvious and betting on the unexpected. "
— George Soros
Trade with insight. Trade with anticipation.
— Dskyz, for DAFE Trading Systems

Pattern Detector [theUltimator5]🎯 Overview
The Pattern Detector is a comprehensive technical analysis indicator that automatically identifies and visualizes multiple pattern types on your charts. Built with advanced ZigZag technology and sophisticated pattern recognition algorithms, this tool helps traders spot high-probability trading opportunities across all timeframes and markets.
✨ Key Features
🔍 Multi-Pattern Detection System
Harmonic Patterns: Butterfly, Gartley, Bat, and Crab patterns with precise Fibonacci ratios
Classic Reversal Patterns: Head & Shoulders and Inverse Head & Shoulders
Double Patterns: Double Tops and Double Bottoms with extreme validation
Wedge Patterns: Rising and Falling Wedges with volume confirmation
📊 Advanced ZigZag Engine
Customizable sensitivity (5-50 levels)
Depth multiplier for multi-timeframe analysis
Real-time pivot detection with noise filtering
Option to display ZigZag lines only for pure price action analysis
🎨 Visualization
Clean pattern lines with distinct color coding
Point labeling system (X, A, B, C, D for harmonics / LS, H, RS for H&S)
Pattern name displays with bullish/bearish direction
Price target projections with arrow indicators
Subtle pattern fills for enhanced visibility
🛠️ Settings & Configuration
Core ZigZag Settings
ZigZag Sensitivity (5-50): Controls pattern detection sensitivity. Lower values detect more patterns but may include noise. Higher values focus on major swings only.
ZigZag Depth Multiplier (1-5): Multiplies sensitivity for deeper analysis. Level 1 = most responsive, Level 5 = major swings only.
Pattern Detection Toggles
Show ZigZag Lines Only: Displays pure ZigZag without pattern detection for price structure analysis
Detect Harmonic Patterns: Enable/disable Fibonacci-based harmonic pattern detection
Detect Head & Shoulders: Toggle classic reversal pattern identification
Detect Double Tops/Bottoms: Enable double pattern detection with extreme validation
Detect Wedge Patterns: Toggle wedge pattern detection with volume confirmation
Display Options
Show Pattern Names: Display pattern names directly on chart (e.g., "Butterfly (Bullish)")
Show Point Labels: Add lettered labels at key pattern points for structure identification
Project Harmonic Targets: Show projected completion points for incomplete harmonic patterns
📈 Pattern Types Explained
Harmonic Patterns 🦋
Advanced Fibonacci-based patterns that provide high-probability reversal signals:
Butterfly: AB=0.786 XA, BC=0.382-0.886 AB, CD=1.618-2.24 BC
Gartley: AB=0.618 XA, BC=0.382-0.886 AB, CD=1.272-1.618 BC
Bat: AB=0.382-0.50 XA, BC=0.382-0.886 AB, CD=1.618-2.24 BC
Crab: AB=0.382-0.618 XA, BC=0.382-0.886 AB, CD=2.24-3.618 BC
Head & Shoulders 👤
Classic three-peak reversal pattern indicating trend exhaustion:
Standard H&S: Bearish reversal at tops
Inverse H&S: Bullish reversal at bottoms
Automatic neckline validation and price target calculation
Double Patterns 📊
Powerful reversal patterns with extreme validation:
Double Top: Two similar highs with valley between (bearish)
Double Bottom: Two similar lows with peak between (bullish)
Includes lookback period validation to ensure patterns are significant extremes
Wedge Patterns 📐
Continuation/reversal patterns with converging trend lines:
Rising Wedge: Converging upward slopes (typically bearish)
Falling Wedge: Converging downward slopes (typically bullish)
Volume confirmation required for increased accuracy
🎯 Trading Applications
Entry Signals
Harmonic Patterns: Enter at point D completion with targets at point A
H&S Patterns: Enter on neckline break with calculated targets
Double Patterns: Enter on support/resistance break with measured moves
Wedge Patterns: Enter on breakout direction with volume confirmation
Risk Management
Use pattern structure for logical stop placement
Pattern invalidation levels provide clear exit rules
Multiple pattern confirmation increases probability
Multi-Timeframe Analysis
Higher ZigZag depth for longer-term patterns
Lower sensitivity for short-term trading patterns
Combine with other timeframes for confluence
⚙️ Optimal Settings
For Day Trading (1m-15m charts)
ZigZag Sensitivity: 5-9
Depth Multiplier: 1-2
Enable all pattern types for maximum opportunities
For Swing Trading (1H-4H charts)
ZigZag Sensitivity: 9-15
Depth Multiplier: 2-3
Focus on harmonic and H&S patterns
For Position Trading (Daily+ charts)
ZigZag Sensitivity: 15-25
Depth Multiplier: 3-5
Emphasize major harmonic and double patterns
🔧 Technical Specifications
Maximum Lookback: 5000 bars for comprehensive analysis
Pattern Overlap Prevention: Intelligent filtering prevents duplicate patterns
Performance Optimized: Efficient algorithms for real-time detection
Volume Integration: Advanced volume analysis for wedge confirmation
Fibonacci Precision: 10% tolerance for harmonic ratio validation
📚 How to Use
Add to Chart: Apply indicator to any timeframe/market
Configure Settings: Adjust sensitivity based on trading style
Enable Patterns: Toggle desired pattern types
Analyze Results: Look for completed patterns with clear structure
Plan Trades: Use price targets and pattern invalidation for trade management
Perfect for both novice and experienced traders seeking systematic pattern recognition with visualization and entry/exit signals.

Supply/Demand Market Structure (SMA Multi-Timeframe)Supply/Demand Based Market Structure
Structure + Order Blocks from Synthetic SMA Candles
Overview:
The SMA Supply/Demand Market Structure indicator combines market structure analysis with supply/demand logic, powered by SMA-based synthetic candles . Instead of relying on raw candle data, this tool generates smoothed higher-timeframe candles using simple moving averages to identify more stable zones and cleaner structure shifts.
It detects bullish and bearish breaks of structure (BoS) , highlights swing points like HH, HL, LH, LL , and plots institutional-style supply and demand zones formed from aggressive rallies or drops. The result is a precise and noise-filtered view of market intent, perfect for trend-following or smart money strategies.
How It Works:
- Synthetic candles are created using SMA of OHLC values on your selected timeframe (HTF).
- A bullish break occurs when price closes above the high of the last bearish synthetic candle.
- A bearish break occurs when price closes below the low of the last bullish synthetic candle.
- Upon break confirmation:
- A demand zone is drawn using the last bearish candle.
- A supply zone is drawn using the last bullish candle.
- Each zone is extended forward for a user-defined number of bars and optionally deleted upon mitigation.
- Zigzag-based internal structure connects valid swing points and classifies them as HH, HL, LH, LL , including Liquidity Sweeps (LS) .
- BoS levels are highlighted with lines that automatically reset when new structure forms.
Key Features:
- Synthetic SMA Candles : Smooth and reliable structure from average-based HTF candles
- Break Modes : Choose between raw HTF closes or SMA closes for break logic
- Custom Timeframe Selection : Analyze structure across any HTF you choose
- Dynamic Supply/Demand Zones : Auto-plot boxes from valid rallies/drops
- Mitigation Detection : Optionally fade or delete zones when price trades through
- Zigzag Structure Mapping : Automatically connect structural highs/lows
- BoS Detection : Real-time breakout of swing points with visual confirmation
- Smart Labels : Marks HH, HL, LH, LL, and LS directly on the chart
- Multi-timeframe Alert System : Notify for all structural changes, BoS, and new zones
How to Use:
- Set your desired HTF and SMA Length for synthetic candle smoothing.
- Use SMA=1 for raw candles
- Select a Break Mode :
- Raw Close : Uses standard HTF close values
- SMA Close : Uses smoothed closes from SMA
- Watch for bullish or bearish breaks — zones are plotted when price confirms breakout structure.
- Use demand zones as long entry areas and supply zones as short setups on retests.
- Rely on internal shifts and zigzag swings to monitor structure continuity.
- Enable alerts for swing formations, BoS, and liquidity sweeps to trade hands-free.
Recommended Strategies:
- Smart Money & ICT Models : Use synthetic demand/supply + BoS for mitigation or continuation plays
- Swing Trading : Align with higher timeframe structure and use zones for entry triggers
- Trend Trading : Confirm structure alignment and wait for pullbacks into zones
- Reversal Entries : Trade structure breaks when zones fail and a BoS confirms the shift
Customization Options:
- Timeframe input for custom HTF control
- SMA Length to adjust candle smoothing
- Zone Style : Control zone color, transparency, and duration
- Structure Display : Toggle swing labels and zigzag visuals
- Alert Mode : Choose between LTF, MTF, or HTF alerts
Summary:
SMA Supply/Demand Market Structure provides a clean, flexible view of price structure and institutional intent by fusing market structure with SMA-based synthetic candles. It’s ideal for anyone seeking reduced noise, visually guided entries, and rule-based trading based on structural shifts and real-time demand/supply dynamics.

Rally/Drop Market Structure (Multi-Timeframe)Rally/Drop Market Structure
Supply and Demand Zones from Bullish/Bearish Breaks
Overview:
The Rally/Drop Market Structure indicator is a powerful price action tool that identifies key structural turning points in the market by detecting bullish and bearish breaks . After each confirmed break, it plots either a demand zone (following a bullish break or rally) or a supply zone (following a bearish break or drop). These zones represent institutional footprints — areas where price is likely to react due to imbalance or unfilled orders.
The indicator is based on synthetic higher timeframe (HTF) candles to provide a more stable and smoothed structural map, improving clarity and signal quality over raw candles.
How It Works:
- A bullish break is defined when price makes a higher high and a higher low (or closes above the previous high depending on your selected mode).
- A bearish break is defined when price makes a lower high and a lower low (or closes below the previous low).
- After a bullish break, the indicator plots a demand zone based on the low and high of the most recent bearish candle — representing where demand stepped in.
- After a bearish break, the indicator plots a supply zone from the most recent bullish candle — indicating where supply took control.
- Optional mitigation logic marks zones as mitigated (or deletes them) once price trades into the opposing side.
- Internal shift detection highlights swing highs and lows , labels structural points (HH, HL, LH, LL), and identifies potential liquidity sweeps .
Features:
- Dynamic plotting of rally-based demand zones and drop-based supply zones
- Toggle to use Highs/Lows or Close-based breaks for structure
- Support for LTF, MTF, and HTF analysis (with selectable timeframe)
- Zone mitigation logic with optional automatic cleanup
- Labeling of key swing points: HH , HL , LH , LL , and LS (Liquidity Sweep)
- Zigzag visualization for structure flow
- Alert-ready for internal shifts, BoS, and zone creation
- Separate styling options for BoS lines, internal shift shapes, and zone colors
How to Use:
- Set your desired HTF candle source (e.g., 1H or 4H) depending on your trading style.
- Use Highs/Lows mode for pure price action structure or Close mode for more conservative signals.
- Observe when a bullish break occurs — a demand zone will form where price previously dropped before rallying. Look for long opportunities if price revisits this zone.
- After a bearish break , a supply zone forms where the rally failed — use this to scout short entries on retests.
- Use BoS lines to confirm structure shifts and validate entry triggers or trend direction.
- Monitor mitigated zones for reduced reliability or avoid them completely by enabling automatic deletion.
- Use alerts to stay notified about key changes without watching the chart constantly.
Recommended Strategies:
- Smart money or ICT-style trading : identify institutional footprints and mitigation setups
- Reversal trading : catch price rejecting off unmitigated zones after structure break
- Trend continuation : enter in the direction of internal structure after pullbacks into zones
- Liquidity sweep confirmation : filter out false breaks using HH/LL with LS detection
Tips:
- Combine this indicator with a higher timeframe bias tool (e.g., moving average, higher timeframe market structure).
- For scalping, use tighter HTFs and reduce the zone duration.
- For swing trading, use larger HTFs (1H, 4H, Daily) and increase zone persistence.
Summary:
The Rally/Drop Market Structure indicator gives you an actionable framework for understanding price structure, market intent, and supply/demand imbalances. Whether you're looking for precision entries, trend confirmation, or smart money concepts, this tool helps simplify complex price behavior into clean, usable structure and zones.

I Want My ScalpsTops/bottoms.
Bull/bear traps.
Designed for NQ / MNQ on 1 min during cash hours.
Time filter update coming soon.

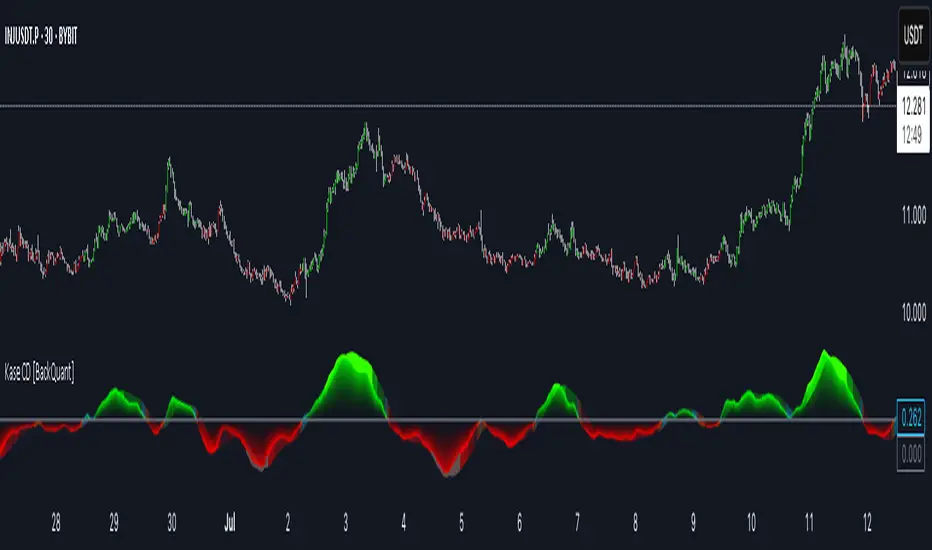
Kase Convergence Divergence [BackQuant]Kase Convergence Divergence
The Kase Convergence Divergence is a sophisticated oscillator designed to measure directional market strength through the lens of volatility-adjusted log return structures. Inspired by Cynthia Kase’s work on statistical momentum and price projection ranges, this unique indicator offers a hybrid framework that merges signal processing, multi-length sweep logic, and adaptive smoothing techniques.
Unlike traditional momentum oscillators like MACD or RSI, which rely on static moving average differences, KCD introduces a dual-process system combining:
Kase-style statistical range projection (via log returns and volatility),
A sweeping loop of lookback lengths for robustness,
First and second derivative modes to capture both velocity and acceleration of price movement.
Core Logic & Computation
The KCD calculation is centered on two volatility-normalized transforms:
KSDI Up: Measures how far the current high has moved relative to a past low, normalized by return volatility.
KSDI Down: Measures how far the current low has moved relative to a past high, also normalized.
For every length in a user-defined sweep range (e.g., 25–35), both KSDI_up and KSDI_dn are computed, and their maximum values across the loop are retained. The difference between these two max values produces the raw signal:
KPO (Kase Projection Oscillator): Measures directional skew.
KCD (Kase Convergence Divergence): Defined as KPO – MA(KPO) — similar in spirit to MACD but structurally different.
Users can choose to visualize either the first derivative (KPO) , or the second derivative (KCD) , depending on market conditions or strategy style.
Key Features
✅ Multi-Length Sweep Logic: Improves signal reliability by aggregating statistical range projections across a set of lookbacks.
✅ Advanced Smoothing Modes: Supports DEMA, HMA, TEMA, LINREG, WMA and more for dynamic adaptation.
✅ Dual Derivative Modes: Choose between speed (first derivative) or smoothness (second derivative) to fit your trading regime.
✅ Color-Encoded Signal Bands: Heatmap-style oscillator coloring enhances visual feedback on trend strength.
✅ Candlestick Painting: Optional bar coloring makes it easy to spot trend shifts on the main chart.
✅ Adaptive Fill Zones: Green and red fills between the oscillator and zero line help distinguish bullish and bearish regimes at a glance.
Practical Applications
📈 Trend Confirmation: Use KCD as a secondary confirmation layer after breakout or pullback entries.
📉 Momentum Shifts: Crossover and crossunder of the zero line highlight potential regime changes.
📊 Strategy Filters: Incorporate into algos to avoid trendless or mean-reverting environments.
🧪 Derivative Switching: Flip between KPO and KCD modes depending on whether you want to measure acceleration or deceleration of price flow.
Alerts & Signals
Two built-in alerts help you catch regime shifts in real time:
Long Signal: Triggered when the selected oscillator crosses above zero.
Short Signal: Triggered when it crosses below zero.
These events can be used to generate entries, exits, or trend validation cues in multi-layer systems.
Conclusion
The Kase Convergence Divergence goes beyond traditional oscillators by offering a volatility-normalized, derivative-aware signal engine with enhanced visual dynamics. Its sweeping architecture and dynamic fill logic make it especially powerful for identifying trending environments, filtering chop, and adding statistical rigor to your trading toolkit.
Whether you’re a discretionary trader seeking precision, or a quant looking to model more robust return structures, KCD offers a creative yet analytically grounded solution.
📡 ETF RADAR HUD (SPY · QQQ · SPX) + Real-Time MomentumOverview
The ETF RADAR HUD is a powerful, all-in-one technical analysis tool designed to provide traders with real-time insights into market trends, momentum, and key indicators for major ETFs and indices, including SPY , QQQ , and SPX . This Pine Script® indicator delivers a visually intuitive heads-up display (HUD) that consolidates critical market data, enabling traders to make informed decisions with confidence.
Important: This indicator is optimized to work in conjunction with Stan's Magic Potion , a complementary tool that enhances its precision and effectiveness. Together, they form a robust system for identifying high-probability trading opportunities in volatile markets.
Key Features
Multi-Asset Compatibility: Automatically detects and adapts to SPY , QQQ , SPX , or other instruments, with tailored visual cues for each.
Real-Time Momentum Detection : Identifies breakout and breakdown signals using a combination of price action, EMA crossovers, and RSI thresholds.
Comprehensive HUD : Displays key metrics including:
*Trend direction (Uptrend, Downtrend, Sideways)
*RSI status (Overbought, Oversold, Neutral)
*Volatility (High, Low)
*Volume spikes
*EMA crossovers (1 vs. 16)
*VWAP and EMA 200 positioning
*Momentum signals (Breakout, Breakdown, Waiting)
Alert System: Configurable alerts for CALL (bullish) and PUT (bearish) momentum signals, ensuring timely notifications for trading opportunities.
Visual Clarity: Color-coded bar highlights and an organized table for at-a-glance analysis.
Why Use ETF RADAR HUD with Stan's Magic Potion?
The ETF RADAR HUD is designed to complement Stan's Magic Potion , creating a synergistic trading system that maximizes signal accuracy and market context. While the HUD provides a real-time snapshot of market conditions, Stan's Magic Potion enhances its signals with proprietary filters and confirmation logic, reducing noise and improving trade reliability. Using these tools together allows traders to:
*Confirm momentum signals with greater confidence.
*Filter out false breakouts or breakdowns.
*Align trades with broader market dynamics.
For optimal results, we strongly recommend integrating this indicator with Stan's Magic Potion to unlock its full potential.
How It Works
The indicator calculates and displays:
Trend Analysis: Compares fast (default: 8) and slow (default: 21) EMAs to determine market direction.
Momentum Signals: Detects breakouts (price above recent highs with buffer) and breakdowns (price below recent lows with buffer), validated by EMA and RSI conditions.
Volatility and Volume: Monitors ATR-based volatility and volume spikes relative to a 20-period SMA.
Key Levels: Tracks price relative to VWAP and the 200-period EMA for long-term trend context.
RSI Mood: Highlights overbought (>70) or oversold (<30) conditions.
HUD Display: Presents all metrics in a clean, top-right table with color-coded statuses for quick interpretation.
Settings
* Fast EMA Period (default: 8): Adjusts the sensitivity of the short-term EMA.
* Slow EMA Period (default: 21): Sets the longer-term EMA for trend analysis.
* RSI Length (default: 14): Defines the RSI calculation period.
* ATR Length (default: 14): Sets the ATR period for volatility assessment.
* Volume Spike Multiplier (default: 1.8): Determines the threshold for volume spike detection.
* Momentum Lookback Bars (default: 5): Sets the lookback period for breakout/breakdown detection.
* Breakout Buffer % (default: 0.05): Adds a buffer to price breakouts for confirmation.
How to Use
* Add the ETF RADAR HUD to your TradingView chart for SPY , QQQ , or SPX .
* Pair it with Stan's Magic Potion for enhanced signal confirmation (highly recommended).
* Monitor the HUD table for real-time insights into trend, momentum, volatility, and volume.
* Set up alerts for CALL (bullish) or PUT (bearish) momentum signals to stay ahead of market moves.
* Adjust input parameters to suit your trading style or timeframe.
Notes
* This indicator is most effective on daily or intraday charts for ETFs and indices.
* Ensure you have access to Stan's Magic Potion for optimal performance, as the two tools are designed to work hand-in-hand.
* Use the alert system to automate notifications for high-probability setups.
Disclaimer
Trading involves risk, and past performance is not indicative of future results. Always conduct your own analysis and risk management before entering trades. This indicator is provided under the Mozilla Public License 2.0.

Profitable Loser Model [MMT]Profitable Loser Model
Overview
The Profitable Loser Model is a powerful PineScript v6 indicator designed to enhance your trading by visualizing key price levels, session open zones, Fibonacci retracements, and premium/discount zones. This overlay indicator provides traders with a customizable toolkit to analyze market structure across any timeframe, making it ideal for intraday and swing trading strategies.
Features
Open Zone Visualization
- Plots a box based on the open and close of the first candle in a user-defined timeframe (default: 5-minute).
- Customizable box color, projection offset, and label size (Tiny, Small, Normal, Large).
- Displays a timeframe label (e.g., "5m Open Zone") for quick reference, toggleable on/off.
Session Open Lines
- Optionally draws horizontal lines at key session opens (8:30 AM, 9:30 AM, 1:30 PM, Midnight, New York time).
- Customize line color, style (Solid, Dashed, Dotted), width, and label size for each session.
- Perfect for identifying critical intraday price levels.
Premium and Discount Zones
- Highlights premium (above midpoint) and discount (below midpoint) zones based on session high/low.
- Toggleable with customizable colors and projection offsets.
- Helps traders spot overbought/oversold areas for potential mean-reversion trades.
Fibonacci Retracement Levels
- Plots user-defined Fibonacci levels (default: 0.23, 0.35, 0.5, 0.62, 0.705, 0.79, 0.886, 1, 1.1).
- Customizable line style, width, color, and labels (showing percentage and/or price).
- Dynamically adjusts based on price movement relative to the open zone.
Take Profit (TP) and Stop Loss (SL) Levels
- Highlights TP (default: 0.23) and SL (default: 1.1) Fibonacci levels with distinct colors.
- Fully customizable to align with your risk-reward strategy.
How It Works
- Session Detection : Resets daily (or per user-defined timeframe) to capture the first candle's open, high, low, and close.
- Open Zone : Draws a box between the open and close, extended forward by the projection offset.
- Session Lines : Plots lines at specified session opens with customizable styles and labels.
- Fibonacci Retracement : Adjusts levels dynamically based on session high/low and price action.
- Premium/Discount Zones : Calculated from the session range midpoint, updated in real-time.
Settings
- Open Zone :
- Timeframe (default: 5m), Calculate Timeframe (default: Daily).
- Toggle label, adjust size, box color, and projection offset.
- Session Open Lines :
- Enable/disable lines for 8:30 AM, 9:30 AM, 1:30 PM, Midnight.
- Customize color, style, width, label size, and vertical offset.
- Premium/Discount Zones :
- Toggle visibility, set colors, and adjust projection offset.
- Fibonacci Retracement :
- Toggle visibility, set custom levels, line style, width, color, and label options.
- Adjust projection offset.
- TP/SL :
- Set TP/SL Fibonacci levels and colors.
Use Cases
- Intraday Trading : Use session open lines and open zones to trade key market hours.
- Swing Trading : Leverage Fibonacci levels for potential reversal or continuation zones.
- Risk Management : Set precise TP/SL levels based on Fibonacci retracements.
- Market Structure : Identify overbought/oversold zones with premium/discount areas.
Notes
- Optimized with `dynamic_requests = true` for efficient real-time data handling.
- Visual elements (boxes, lines, labels) are cleaned up at the start of each new session.
- Session lines use New York time (`America/New_York`) for alignment with major markets.

Crypto Spot Volume Ratio**Overview**
This TradingView Pine Script v7 indicator computes and visualizes each exchange’s spot‐volume share relative to the average across ten major venues. By plotting ten “volume coefficients” around a baseline of 1, you immediately see which exchanges are trading above or below the aggregate average in each bar (timeframe period).
---
## 1. Data Sources
The script pulls spot trading volume for the current symbol (e.g. BTC/USDT, ETH/USDT, SOL/USDT, etc.) from these ten exchanges:
* Binance
* OKX
* Bybit
* KuCoin
* Gate.io
* HTX
* Kraken (USD pair)
* Coinbase (USD pair)
* Bitstamp (USD pair)
* Bitfinex (USD pair)
For USD-quoted venues (Coinbase, Kraken, Bitstamp, Bitfinex), it automatically converts the symbol suffix from “USDT” to “USD.”
---
## 2. Calculation Steps
1. **Fetch Volumes**
Using `request.security`, the script retrieves `volume` from each exchange’s contract at the chart’s timeframe.
2. **Sum and Average**
* **Total Volume (`sumVol`)** = sum of all ten exchanges’ volumes.
* **Average Volume (`avgVol`)** = `sumVol / 10‘.
3. **Compute Coefficients**
For each exchange *i*,
A coefficient > 1 means that exchange’s volume is above the ten‐exchange average; < 1 means below average.
4. **Rendering**
* **Table**: A horizontal row in the top‐right corner lists each enabled exchange’s coefficient (formatted to two decimals).
* **Plots**: Ten overlaid line plots show each exchange’s coefficient time series. A dashed horizontal line at **1** marks the average baseline.
---
## 3. Configuration Options
In the indicator’s settings panel, you can toggle **“Show …”** for any of the ten exchanges. Disabling an exchange will hide both its table entry and its plotted line—but does **not** change the average calculation (which always divides by 10).
---
## 4. Interpretation & Significance
* **Relative Activity**: By normalizing each venue to the ten‐exchange average, you spot shifts in where volume is concentrated.
* **Liquidity Insights**: Exchanges consistently above 1 may offer deeper liquidity, tighter spreads, or attract more order flow. Those below 1 may lag on volume, signaling lower activity or potential outages.
* **Arbitrage & Flow Monitoring**: Sudden spikes on a particular exchange (coefficient >> 1) can indicate localized buying/selling pressure, useful for spotting arbitrage windows, large order flows, or exchange-specific events.
* **Market Health**: Tracking the dispersion of these coefficients over time gives you a quick visual of how balanced or skewed the overall market activity is across venues.
---
## 5. How It Works in Practice
1. **Attach** this indicator to any USDT or USD spot chart (e.g., BTCUSDT, ETHUSDT).
2. **Observe** which exchange lines rise above the dashed **1** line—those venues are currently trading more volume than the average of the ten.
3. **Use** the table to see exact coefficient values each bar.
4. **Toggle** exchanges on/off to focus on specific venues without affecting the universal average baseline.
By comparing ten exchanges on a single pane, you gain real-time clarity on where crypto liquidity and activity are most intense—and where it temporarily wanes—empowering more informed trading, arbitrage strategies, and market‐structure analysis.

Premium Fibonacci Buy/Sell [MasoodPro]OVERVIEW
This script plots Fibonacci Entry Bands, a trend-following and mean-reversion hybrid system built around dynamic volatility-adjusted bands scaled using key Fibonacci levels. It calculates a smoothed basis line and overlays multiple bands at fixed Fibonacci multipliers of either ATR or standard deviation. Depending on the trend direction, specific upper or lower bands become active, offering a clear framework for entry timing, trend identification, and profit-taking zones.
CONCEPTS
The core idea is to use Fibonacci levels—0.618, 1.0, 1.618, and 2.618—as multipliers on a volatility measure to form layered price bands around a trend-following moving average. Trends are defined by whether the basis is rising or falling. The trend determines which side of the bands is emphasized: upper bands for downtrends, lower bands for uptrends. This approach captures both directional bias and extreme price extensions. Take-profit logic is built in via crossovers relative to the outermost bands, scaled by user-selected aggressiveness.
FEATURES
Basis Line – A double EMA smoothing of the source defines trend direction and acts as the central mean.
snapshot
Volatility Bands – Four levels per side (based on selected ATR or stdev) mark the Fibonacci bands. These become visible only when trend direction matches the side (e.g., only lower bands plot in an uptrend).
snapshot
Bar Coloring – Bars are shaded with adjustable transparency depending on distance from the basis, with color intensity helping gauge overextension.
snapshot
Entry Arrows – A trend shift triggers either a long or short signal, with a marker at the outermost band with ▲/▼ signs.
snapshot
Take-Profit Crosses – If price rejects near the outer band (based on aggressiveness setting), a cross appears marking potential profit-taking.
snapshot
Bounce Signals – Minor pullbacks that respect the basis line are marked with triangle arrows, hinting at continuation setups.
snapshot
Customization – Users can toggle bar coloring, signal markers, and select between ATR/stdev as well as take-profit aggressiveness.
Alerts – All major signals, including entries, take-profits, and bounces, are available as alert conditions.

ZYTX GKDDThe ZYTX High-Sell Low-Buy Indicator Strategy is a trend-following indicator that integrates multiple indicator resonances. It demonstrates the perfect performance of an automated trading robot, truly achieving the high-sell low-buy strategy in trading.

VSA-Stopping VolumeVSA Stopping Volume Indicator
Stopping Volume occurs when candles show decreasing body sizes (narrow spreads) while volume steadily increases.
Example chart:
As you see:
3 consecutive candles in same direction (all green OR all red)
Body sizes (spreads) decreasing progressively: Candle 1 > Candle 2 > Candle 3
Volume increasing progressively: Volume 1 < Volume 2 < Volume 3
This pattern indicates price absorption - increased buying/selling pressure but declining price movement, often signaling exhaustion and potential reversal.
Indicator Features
This indicator detects Stopping Volume candlestick clusters with two signal types:
🔹 BUY/SELL Signals: Generated when pattern occurs at support/resistance zones
🔹 Directional Alerts (▲-green, ▼-red): Generated when pattern occurs outside key levels
Trading Guidelines:
⚠️ Auto-drawn S/R zones are reference only - manual level plotting recommended for accuracy
📊 Best for scalping: M5, M10, M15 timeframes
🛡️ Stop Loss: Place beyond the S/R zone you're trading
🎯 Take Profit: Based on your risk management
Key Concept: Volume expansion + price contraction = potential reversal, especially at SnR levels.
Perfect for scalpers looking to catch reversals at critical zones!

ZYTX SuperTrend V1ZYTX SuperTrend V1 Indicator
Multi-strategy intelligent rebalancing with >95% win rate
Enables 24/7 automated trading

Fibonacci retracementHi all!
This indicator will show you the most recent Fibonacci retracement in the current trend. So if the trend is bullish the Fibonacci retracement will be drawn from swing low to high and from swing high to low in a bearish trend.
The uniqueness in this script lies in the adaptation to trend. To only plot the Fibonacci retracements according to the current market trend.
The trend is determined through break of structures (BOS) and change of characters (CHoCH). A change of character can be of type change of character plus (with a failed swing) and will then be shown as CHoCH+. This is possible through my library 'MarketStructure' (). It only uses break of structures and change of characters to be able to determine the trend, if you want a more detailed picture of the market structure you can use my script 'Market structure' ().
History and what to look for
Fibonacci retracement levels are used by many traders and are levels that are not Fibonacci sequence numbers themselves but they deriver from them. Some examples are:
23,6% - Divide a number by one three places ahead (e.g. 13/55)
38,2% - Divide a number by the one two places ahead (e.g. 21/55)
50% - Not from the Fibonacci sequence, but it's a number that price has reacted from in the past. Markets tend to retrace half a move before continuing
61,8% - The "golden retracement level". It derives from the "golden ratio" and is a core component of the Fibonacci sequence. The further you go in the Fibonacci sequence the preceding number divided by the current number will get closer and closer to this "golden ratio". This level is considered the most important Fibonacci retracement level by many traders
78,6% - Square root of 61.8%. This is often considered a deep correction (but not a trend reversal) and are often used for late entries
These levels are considered "key" and most significant. You want to look for a retracement of the price (down in a bullish trend and up in a bearish trend) to give you good entries.
Settings
For the trend you can set the pivot/swing lengths (right and left) and use the checkbox if you want these pivots to have labels. This can be done in the 'Market strucure' section.
In the 'Fibonacci retracement' section there is settings for the actual Fibonacci retracement. You can enable the trendline, set the color and the style of it. You can select which levels that should be shown by the indicator. There are 11 levels enabled by default, they are; 0-4.236. All settings in this section tries to be as similar to the "Fib Retracement" tool in Tradingview. You can also select the style of these lines (solid, dashed or dotted) and if you want them to extend to the right or not.
After this you can select if the Fibonacci retracement should be reversed or not, if prices should be displayed, if levels should be displayed and if to show the decimal levels or percentages and lastly the font size of these labels.
All defaults are based on the "Fib Retracement" tool by Tradingview.
Visualization
This indicator aims to be as visually similar to the default ("Fib Retracement") tool here on Tradingview. It will plot the Fibonacci retracement (called Auto Fibonacci/Auto fib) according to the trend from the library 'MarketStrucure'. The big differences from the "Fib Retracement" tool by Tradingview is that it's automatic (that adapts to trend), the market structure is visualized through lines and labels (showing 'BOS' for break of structures and 'CHoCH'/'CHoCH+' for change of characters) and that the labels showing information about the levels are positioned to be highly visible (left if <50% otherwise right if in a bullish trend, vice versa in a bearish trend or if reversed).
Don't hesitate if you have any feedback or nice feature suggestions!
Best of trading luck!

MCC Smart Reversal Signals📊 MCC Smart Reversal Signals (Stoch RSI) v1.0.9
© 2025 Jawid Iqbal Anwar — MIT License
This indicator is designed to help traders detect potential market reversal points by combining multiple confirmation tools such as:
Stochastic RSI
Classic RSI
Trend direction (EMA-based)
Candlestick reversal patterns
Re-entry logic
Dollar-Cost Averaging (DCA) strategy
Built-in alert system
🔄 What’s New in v1.0.9
✅ Time-Frame Presets: Choose from Custom, Weekly, Daily, 4H, 1H, or 15m profiles — each with optimized parameters.
🤖 Auto Mode: The script can automatically detect the chart timeframe and apply the best preset settings.
🎯 Dynamic Overbought/Oversold Levels:
On 15m and 1H, RSI and Stoch RSI use 6 (Oversold) and 94 (Overbought)
On 4H, Daily, and Weekly, it uses 30/70 for RSI and 20/80 for Stoch RSI
🧠 All original logic from v1.0.8 is retained: signal throttling, strong confirmation, and DCA logic.
🔧 How It Works
1. Watch Buy / Watch Sell Signals
These are early signals that notify you of a possible reversal forming.
🟠 Watch Buy: Triggered when the Stoch RSI enters oversold territory. Will only appear if the market isn’t trending strongly downward.
🔵 Watch Sell: Triggered when the Stoch RSI moves into overbought territory. Once fired, it will pause for a few candles unless the zone is exited.
⚠️ OB/OS zones are adjusted based on the selected preset or Auto mode.
2. Strong Reversal Signals (Higher Confidence)
These provide stronger confirmation when all of the following align:
RSI is in an extreme zone (very low or very high)
A reversal candlestick pattern appears (doji, bullish/bearish)
RSI recently changed direction
EMA trend supports the move (not against a strong trend)
When this happens, you’ll see a green (Buy) or red (Sell) label. These are typically high-probability entries.
3. Re-Entry Dots
If the price stays oversold or overbought for a while and forms a new valid candle setup, a new “Watch” dot will appear.
🔁 These help you catch continuation or delayed reversal setups.
4. DCA (Dollar-Cost Averaging) Signals
✅ DCA Buy: RSI is very low and Stoch RSI remains in the oversold zone — a good place to scale into a long position.
❌ DCA Sell: RSI and Stoch RSI are both in the overbought zone — ideal for scaling out or taking profit.
5. Signal Throttling (Smarter Alerts)
To avoid over-signal noise, the script includes throttling logic:
A signal won’t repeat unless the zone is exited and re-entered.
There’s a minimum bar gap between signals to reduce clutter.
🔔 Built-in Alerts (No Setup Needed)
The script includes alerts for all signal types:
Watch Buy / Watch Sell
Strong Buy / Strong Sell
DCA Buy / DCA Sell
Once you add the script to your chart, you can enable alerts immediately.
🕒 How to Use Timeframes
With v1.0.9, the indicator adapts to your chart:
Auto Mode: Just load the indicator — it adjusts based on your active timeframe.
Manual Presets: Choose a preset if you want specific control.
Timeframe Default OB/OS Settings
15m & 1H RSI & Stoch RSI: 6 / 94
4H+ RSI: 30 / 70, Stoch RSI: 20 / 80
🛠️ Suggested Trading Flow
Add the indicator and select a timeframe preset (or use Auto).
Wait for 🟠 Watch Buy or 🔵 Watch Sell — watch the price behavior.
If a 🟢 Strong Buy or 🔴 Strong Sell appears, consider entering with confirmation.
Use ✅ DCA Buy or ⏺️ DCA Sell to scale in/out slowly.
Use EMA trend and candlestick context to refine your decision.
💡 Final Tips
Let signals come to you — don’t force trades.
Use the OB/OS zones and alerts as part of a structured strategy.
Combine this tool with your price action knowledge for best results.

Essa - Market Structure & Fibonacci ToolkitOverview
The Essa Market Structure & Fibonacci Toolkit is a comprehensive trading indicator that combines advanced market structure analysis with customizable fibonacci levels and fair value gap detection. It identifies high-probability trading opportunities by detecting confluence zones where multiple technical factors align, providing traders with precise entry and exit points based on institutional trading concepts.
Key Features
📊Market Structure Analysis
Pattern Recognition: Automatically detects Higher Highs (HH), Higher Lows (HL), Lower Highs (LH), Lower Lows (LL)
Change of Character (CHoCH): Identifies trend changes and market structure breaks
Pattern Locking: Fibonacci levels lock to specific swing patterns (LH→LL for bearish, HL→HH for bullish)
Multi-Timeframe Analysis: Analyzes trend strength across multiple timeframes with scoring system
🧮 Custom Fibonacci System
Fully Configurable Levels: Set any percentage (e.g., 25%, 65%, 87.5%) - not limited to traditional levels
Dynamic Labels: Shows your actual percentages, not hardcoded values
Golden Zone Trading: Customizable optimal entry zones between any two fibonacci levels
Auto-Extension: Levels automatically extend as price moves
Distance Tables: Real-time pip distances to nearest fibonacci levels
📈 Fair Value Gap (FVG) Detection
Smart Detection: Identifies bullish and bearish fair value gaps with size filtering
Age Tracking: Shows how long each FVG has been active (bars or time format)
Confluence Highlighting: Enhanced colors when FVGs overlap with fibonacci golden zones
Width Filtering: ATR-based minimum width requirements to filter noise
🎯 Confluence Trading
Multi-Factor Analysis: Combines market structure + fibonacci + FVGs + golden zones
High-Probability Zones: Highlights areas where multiple factors converge
Trend Strength Scoring: 0-100% scoring system based on multiple confluence factors
Smart Alerts: Notifications for high-confluence setups only
⚡ Advanced Features
Trend Analysis Table: Real-time trend bias, strength score, and pattern identification
Adaptive Sensitivity: Automatically adjusts to market volatility using ATR
Professional Alerts: Customizable alerts for structure breaks, golden zone touches, and FVG confluence
Clean Interface: Basic/Advanced settings organization with inline controls
🎨 Visual Excellence
Professional Styling: Clean, institutional-grade visual presentation
Customizable Colors: Full color customization for all elements
Smart Labeling: Context-aware labels that don't overlap
Performance Optimized: Efficient rendering with visual element limits
Perfect for: Swing traders, day traders, and institutional-style traders who want to identify high-probability setups using confluence of market structure, fibonacci levels, and fair value gaps.


Universal Renko Bars by SiddWolfUniversal Renko Bars or UniRenko Bars is an overlay indicator that applies the logic of Renko charting directly onto a standard candlestick chart. It generates a sequence of price-driven bricks, where each new brick is formed only when the price moves a specific amount, regardless of time. This provides a clean, price-action-focused visualization of the market's trend.
WHAT IS UNIVERSAL RENKO BARS?
For years, traders have faced a stark choice: the clean, noise-free world of Renko charts, or the rich, time-based context of Candlesticks. Choosing Renko meant giving up your favorite moving averages, volume profiles, and the fundamental sense of time. Choosing Candlesticks meant enduring the market noise that often clouds true price action.
But what if you didn't have to choose?
Universal Renko Bars is a revolutionary indicator that ends this dilemma. It's not just another charting tool; it's a powerful synthesis that overlays the pure, price-driven logic of Renko bricks directly onto your standard candlestick chart. This hybrid approach gives you the best of both worlds:
❖ The Clarity of Renko: By filtering out the insignificant noise of time, Universal Renko reveals the underlying trend with unparalleled clarity. Up trends are clean successions of green bricks; down trends are clear red bricks. No more guesswork.
❖ The Context of Candlesticks: Because the Renko logic is an overlay, you retain your time axis, your volume data, and full compatibility with every other time-based indicator in your arsenal (RSI, MACD, Moving Averages, etc.).
The true magic, however, lies in its live, Unconfirmed Renko brick. This semi-transparent box is your window into the current bar's real-time struggle. It grows, shrinks, and changes color with every tick, showing you exactly how close the price is to confirming the trend or forcing a reversal. It’s no longer a lagging indicator; it’s a live look at the current battle between buyers and sellers.
Universal Renko Bars unifies these two powerful charting methods, transforming your chart into a more intelligent, noise-free, and predictive analytical canvas.
HOW TO USE
To get the most out of Universal Renko Bars, here are a few tips and a full breakdown of the settings.
Initial Setup for the Best Experience
For the cleanest possible view, it's highly recommended that you hide the body of your standard candlesticks, that shows only the skelton of the candle. This allows the Renko bricks to become the primary focus of your chart.
→ Double click on the candles and uncheck the body checkbox.
Settings Breakdown
The indicator is designed to be powerful yet intuitive. The settings are grouped to make customization easy.
First, What is a "Tick"?
Before we dive in, it's important to understand the concept of a "Tick." In Universal Renko, a Tick is not the same as a market tick. It's a fundamental unit of price movement that you define. For example, if you set the Tick Size to $0.50, then a price move of $1.00 is equal to 2 Ticks. This is the core building block for all Renko bricks. Tick size here is dynamically determined by the settings provided in the indicator.
❖ Calculation Method (The "Tick Size" Engine)
This section determines the monetary value of a single "Tick."
`Calculation Method` : Choose your preferred engine for defining the Tick Size.
`ATR Based` (Default): The Tick Size becomes dynamic, based on market volatility (Average True Range). Bricks will get larger in volatile markets and smaller in quiet ones. Use the `ATR 14 Multiplier` to control the sensitivity.
`Percentage` : The Tick Size is a simple percentage of the current asset price, controlled by the `Percent Size (%)` input.
`Auto` : The "set it and forget it" mode. The script intelligently calculates a Tick Size based on the asset's price. Use the `Auto Sensitivity` slider to make these automatically calculated bricks thicker (value > 1.0) or thinner (value < 1.0).
❖ Parameters (The Core Renko Engine)
This group controls how the bricks are constructed based on the Tick Size.
`Tick Trend` : The number of "Ticks" the price must move in the same direction to print a new continuation brick. A smaller value means bricks form more easily.
`Tick Reversal` : The number of "Ticks" the price must move in the opposite direction to print a new reversal brick. This is typically set higher than `Tick Trend` (e.g., double) to filter out minor pullbacks and market noise.
`Open Offset` : Controls the visual overlap of the bricks. A value of `0` creates gapless bricks that start where the last one ended. A value of `2` (with a `Tick Reversal` of 4) creates the classic 50% overlap look.
❖ Visuals (Controlling What You See)
This is where you tailor the chart to your visual preference.
`Show Confirmed Renko` : Toggles the solid-colored, historical bricks. These are finalized and will never change. They represent the confirmed past trend.
`Show Unconfirmed Renko` : This is the most powerful visual feature. It toggles the live, semi-transparent box that represents the developing brick. It shows you exactly where the price is right now in relation to the levels needed to form the next brick.
`Show Max/Min Levels` : Toggles the horizontal "finish lines" on your chart. The green line is the price target for a bullish brick, and the red line is the target for a bearish brick. These are excellent for spotting breakouts.
`Show Info Label` : Toggles the on-chart label that provides key real-time stats:
🧱 Bricks: The total count of confirmed bricks.
⏳ Live: How many chart bars the current live brick has been forming. These bars forms the Renko bricks that aren't confirmed yet. Live = 0 means the latest renko brick is confirmed.
🌲 Tick Size: The current calculated value of a single Tick.
Hover over the label for a tooltip with live RSI(14), MFI(14), and CCI(20) data for additional confirmation.
TRADING STRATEGIES & IDEAS
Universal Renko Bars isn't just a visual tool; it's a foundation for building robust trading strategies.
Trend Confirmation: The primary use is to instantly identify the trend. A series of green bricks indicates a strong uptrend; a series of red bricks indicates a strong downtrend. Use this to filter out trades that go against the primary momentum.
Reversal Spotting: Pay close attention to the Unconfirmed Brick . When a strong trend is in place and the live brick starts to fight against it—changing color and growing larger—it can be an early warning that a reversal is imminent. Wait for the brick to be confirmed for a higher probability entry.
Breakout Trading: The `Max/Min Levels` are your dynamic breakout zones. A long entry can be considered when the price breaks and closes above the green Max Level, confirming a new bullish brick. A short entry can be taken when price breaks below the red Min Level.
Confluence & Indicator Synergy: This is where Universal Renko truly shines. Overlay a moving average (e.g., 20 EMA). Only take long trades when the green bricks are forming above the EMA. Combine it with RSI or MACD; a bearish reversal brick forming while the RSI shows bearish divergence is a very powerful signal.
A FINAL WORD
Universal Renko Bars was designed to solve a fundamental problem in technical analysis. It brings together the best elements of two powerful methodologies to give you a clearer, more actionable view of the market. By filtering noise while retaining context, it empowers you to make decisions with greater confidence.
Add Universal Renko Bars to your chart today and elevate your analysis. We welcome your feedback and suggestions for future updates!
Follow me to get notified when I publish New Indicator.
~ SiddWolf

Initial Balance Wave MapThis indicator visualizes the Initial Balance (IB) range for any session, marking the first hour's high and low. It includes optional midpoints, extensions (e.g. 1.5x IB, 2x IB), and customizable time windows. Additional features allow users to display session open, high, low, close, and VWAP reference points. Designed to support price action and session structure analysis, it adapts to various global futures and FX market opens. All display elements are optional and fully configurable.
This updated indicator builds upon the open-source foundation by @noop-noop with enhancements and user-facing labels tailored for Auction Market Theory, scalping, and structure-based trade setups.
Key updated Featured: Multiple previous day's IB levels carry forward into the current day's chart, as opposed to just the previous day's levels carrying forward to the new IB time.
🙌 Credits:
This script builds upon the excellent open-source work by @noop-noop. Original script available here .
