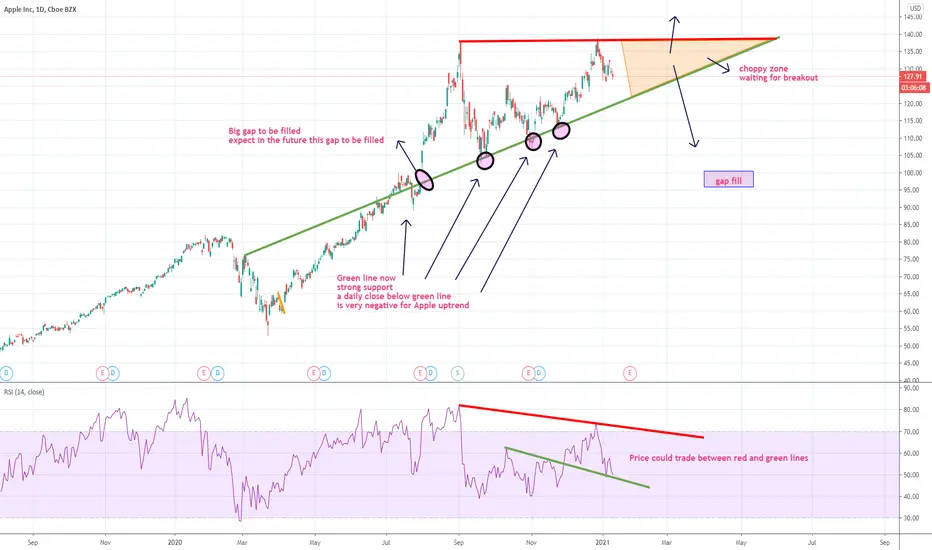
Hello everyone this is my apple idea on daily time frame ..
On my analysis I am trying to make things very simple with good entry and exist ..
We can see price is trading between red line and green line ..
Green line held as support many time as shown in the chart …
And red line is being a roof resistance … my expectation
Price is about to break out in a direction I will talk about my entry and exist .. for best R:R
Bull thesis ( buying )
I wanna be a buyer from green line to target red line .. stop loss daily candle close below green line
I wanna buy if price close above red line to target 160 .. as long as red line hold as support meaning no daily candle close below red line
Bear thesis ( selling )
I wanna sell from red line to target green line .. stop loss daily candle close above red line
I wanna sell if price close below green line to target Gap below .. as long as green line hold as resistance .. meaning no daily candle close above
RSI can help us with good hint indicator .. price is trading between red and green line … if a breach happen trend can change
for any question feel free to ask :) good luck
免責聲明
這些資訊和出版物並不意味著也不構成TradingView提供或認可的金融、投資、交易或其他類型的意見或建議。請在使用條款閱讀更多資訊。
免責聲明
這些資訊和出版物並不意味著也不構成TradingView提供或認可的金融、投資、交易或其他類型的意見或建議。請在使用條款閱讀更多資訊。
