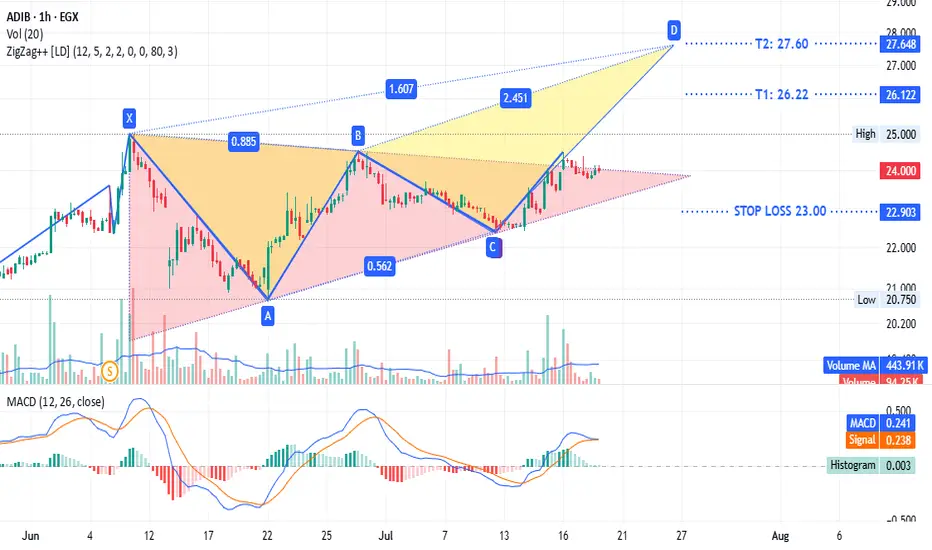
Is showing a triangle pattern with a potential bearish trend. It is currently testing the upper line of the triangle. The stop loss is at 23.00, and the target sell point ranges from 26.22 to 27.60.
This is not investment advice, only my analysis based on the chart data. Consult your account manager before making any investment decisions. Good luck.
交易進行
retest the triangle pattern i think it is an opportunity to open long position by low risk
This is not investment advice, only my analysis based on the chart data. Consult your account manager before making any investment decisions. Good luck.
免責聲明
這些資訊和出版物並非旨在提供,也不構成TradingView提供或認可的任何形式的財務、投資、交易或其他類型的建議或推薦。請閱讀使用條款以了解更多資訊。