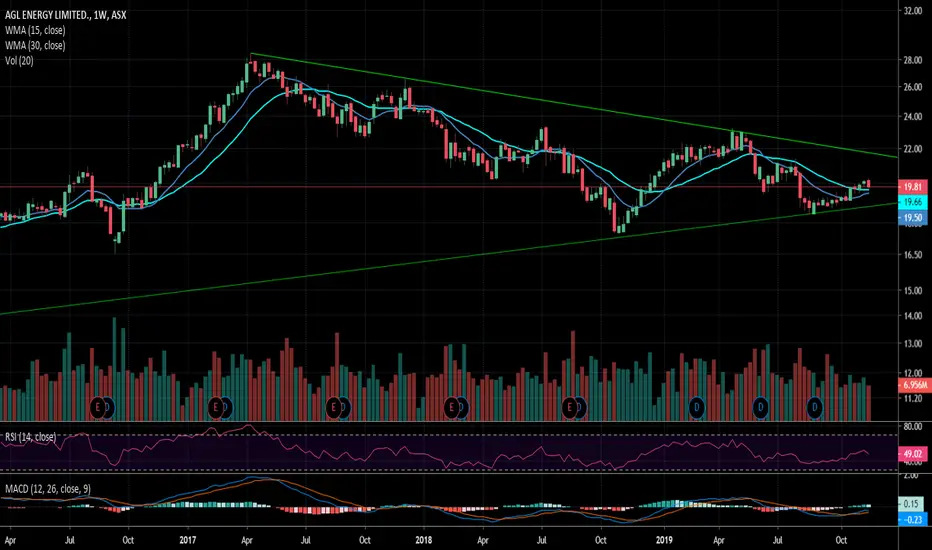
Chart indicating that the bottom is potentially in here; positive indicator that the SP is above the WMA. Would be bullish if we see the top of the wedge broken in the coming weeks and/or an uptick in volume.
免責聲明
這些資訊和出版物並不意味著也不構成TradingView提供或認可的金融、投資、交易或其他類型的意見或建議。請在使用條款閱讀更多資訊。
免責聲明
這些資訊和出版物並不意味著也不構成TradingView提供或認可的金融、投資、交易或其他類型的意見或建議。請在使用條款閱讀更多資訊。