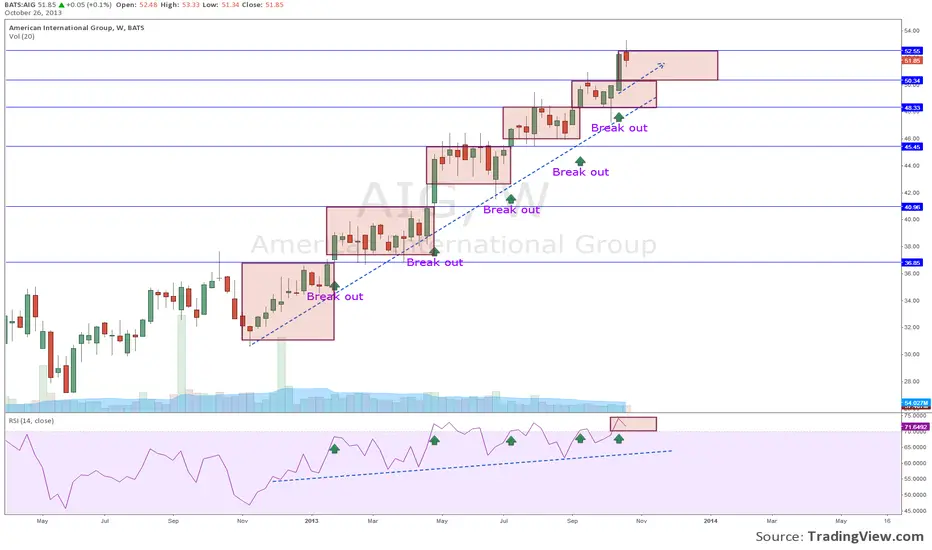
AIG long and strong on the weekly candle.
This is a continuation of a series of previous posted charts .
tradingview.com/v/LCD1fRMj/
tradingview.com/v/KLmqANDH/
tradingview.com/v/kAyKlDdn/
As show here, on weekly chart AIG now broke the resistance at $50.3, into the next zone of consolidation. I expect the RSI to drop a bit (to around 60-70s) before continuing the next leg up. The bullish trend is certainly up and strong.
Disclosure: No position in AIG at the time of analysis
免責聲明
這些資訊和出版物並不意味著也不構成TradingView提供或認可的金融、投資、交易或其他類型的意見或建議。請在使用條款閱讀更多資訊。