--
### 📊 **Technical Analysis Summary:**
#### 🔹 **Chart Pattern:**
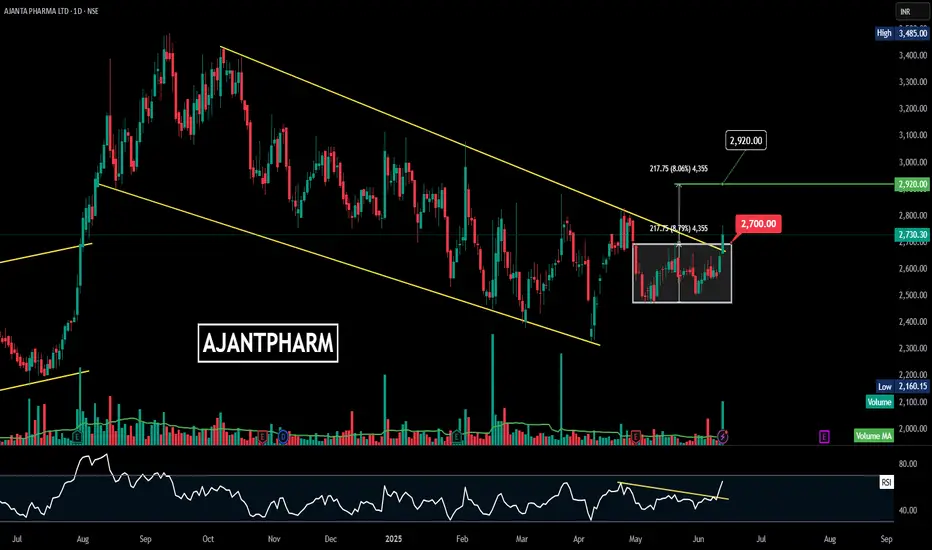
* **Falling Channel** (Yellow trendlines): Price has been respecting a downward-sloping channel since mid-2023.
* Recently, the price **broke out above the upper trendline**, indicating a **potential trend reversal**.
#### 🔹 **Consolidation Zone:**
* There was a **rectangle consolidation** (boxed region) between ₹2,480 and ₹2,700.
* The breakout above ₹2,700 confirms bullish intent and may act as a new support.
#### 🔹 **Breakout Target:**
* The measured move from the box is **approx. ₹217.75**.
* Adding to the breakout level gives a projected **target of ₹2,920**.
#### 🔹 **Volume:**
* **Volume spike** on breakout day = strong confirmation of the breakout.
#### 🔹 **RSI (Relative Strength Index):**
* RSI broke out of its own **downtrend resistance**.
* Now trading above 60 = bullish momentum building up.
---
### 🎯 **Levels to Watch:**
| Type | Price (₹) |
| ----------------------- | ----------- |
| **Breakout Point** | 2,700 |
| **Current Price** | 2,730 |
| **Target** | 2,920 |
| **Support Zone** | 2,480–2,700 |
| **Volume Confirmation** | Yes ✅ |
---
### ✅ **Conclusion:**
Ajanta Pharma is showing strong bullish signs:
* Breakout from falling channel
* Volume-backed move
* RSI confirmation
**As long as the price holds above ₹2,700**, the upside towards ₹2,920 remains intact.
免責聲明
這些資訊和出版物並不意味著也不構成TradingView提供或認可的金融、投資、交易或其他類型的意見或建議。請在使用條款閱讀更多資訊。
免責聲明
這些資訊和出版物並不意味著也不構成TradingView提供或認可的金融、投資、交易或其他類型的意見或建議。請在使用條款閱讀更多資訊。
