🔍 Chart Structure & Key Levels
Horizontal Resistance:
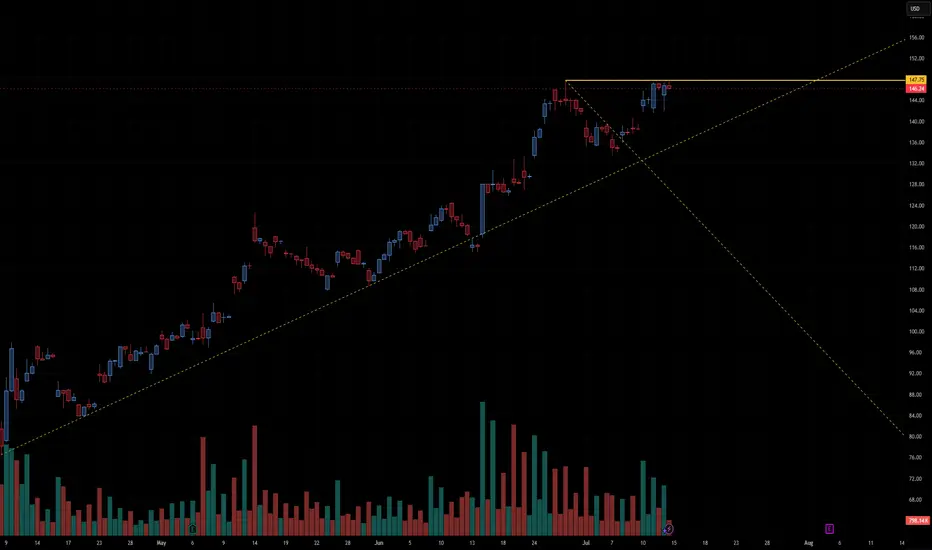
The stock is repeatedly testing the $147.75 level, which is acting as a horizontal resistance (shown in orange). Price has stalled here for several sessions, creating a tight range just below resistance—a common precursor to breakouts.
Ascending Trendline Support:
A long-term upward trendline (dashed yellow) supports the current move. Price has respected this line multiple times, showing a strong bullish structure over the past few months.
Volume Analysis:
Volume has decreased during the recent consolidation near the highs, which is typical before a breakout. However, we want to see a volume spike on a confirmed breakout above $147.75 to validate strength.
Symmetrical Triangle / Coil:
There's a tightening pattern forming between the rising trendline and the flat resistance, indicating price compression. This type of structure is often resolved with a large directional move.
✅ Bullish Scenario
A confirmed breakout above $147.75 with volume expansion could trigger a strong upward move.
Price could quickly target the psychological level near $150, and potentially beyond to $155+, based on the height of the prior impulse wave.
⚠️ Bearish Breakdown Scenario
If price fails to break above $147.75 and breaks the ascending trendline, a pullback to $140 or $135 becomes likely.
A breakdown would invalidate the current bullish structure and signal a potential short-term reversal.
🧠 Summary
This chart is in a bullish consolidation with a coiled setup just under major resistance. A breakout above $147.75 is the critical level to watch for upside continuation. Traders should monitor volume and candlestick confirmation before entering positions.
Horizontal Resistance:
The stock is repeatedly testing the $147.75 level, which is acting as a horizontal resistance (shown in orange). Price has stalled here for several sessions, creating a tight range just below resistance—a common precursor to breakouts.
Ascending Trendline Support:
A long-term upward trendline (dashed yellow) supports the current move. Price has respected this line multiple times, showing a strong bullish structure over the past few months.
Volume Analysis:
Volume has decreased during the recent consolidation near the highs, which is typical before a breakout. However, we want to see a volume spike on a confirmed breakout above $147.75 to validate strength.
Symmetrical Triangle / Coil:
There's a tightening pattern forming between the rising trendline and the flat resistance, indicating price compression. This type of structure is often resolved with a large directional move.
✅ Bullish Scenario
A confirmed breakout above $147.75 with volume expansion could trigger a strong upward move.
Price could quickly target the psychological level near $150, and potentially beyond to $155+, based on the height of the prior impulse wave.
⚠️ Bearish Breakdown Scenario
If price fails to break above $147.75 and breaks the ascending trendline, a pullback to $140 or $135 becomes likely.
A breakdown would invalidate the current bullish structure and signal a potential short-term reversal.
🧠 Summary
This chart is in a bullish consolidation with a coiled setup just under major resistance. A breakout above $147.75 is the critical level to watch for upside continuation. Traders should monitor volume and candlestick confirmation before entering positions.
免責聲明
這些資訊和出版物並不意味著也不構成TradingView提供或認可的金融、投資、交易或其他類型的意見或建議。請在使用條款閱讀更多資訊。
免責聲明
這些資訊和出版物並不意味著也不構成TradingView提供或認可的金融、投資、交易或其他類型的意見或建議。請在使用條款閱讀更多資訊。