🧠 Analysis Overview:
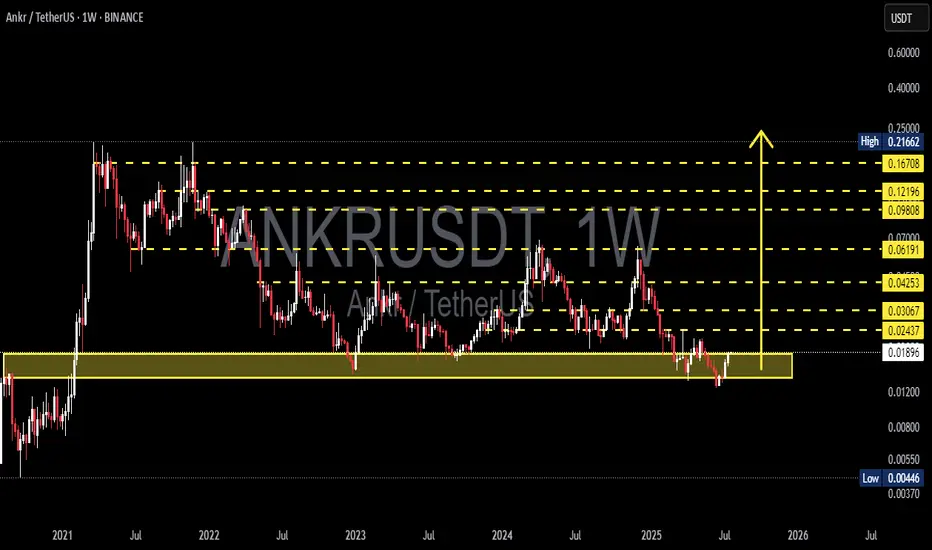
ANKR is showing strong signs of a potential macro reversal after bouncing off its historical demand zone around 0.017–0.019 USDT. This zone has proven to be a significant accumulation area in past cycles — fueling major rallies in both 2021 and 2023. The recent reaction at this level could mark the beginning of a substantial bullish leg in the mid-to-long term.
🔍 Pattern & Structure Breakdown:
✅ Demand Zone Re-Tested:
This zone has been tested multiple times over the years and continues to attract buying interest, signaling institutional accumulation.
✅ Potential Weekly Double Bottom:
Price has formed a clear double bottom with a strong bullish rejection candle, indicating buyers are stepping back in.
✅ Macro Accumulation Range:
For nearly two years, ANKR has been ranging between 0.018 – 0.21 USDT. It’s currently at the bottom of that range, providing a high risk-reward opportunity.
✅ Fibonacci Extension Targets:
Well-defined horizontal resistances (in yellow) suggest clear roadmap targets for bullish continuation — ranging from 0.024 to 0.216.
🚀 Bullish Scenario (HIGH PROBABILITY SETUP):
Ideal Entry Zone: 0.018–0.020 USDT
Initial Breakout Confirmation: Above 0.02437
Progressive Targets:
0.03067 – minor resistance
0.04253 – previous swing high
0.06191 – historical supply
0.09808 – 0.12196 – prior distribution zone
0.16708 – 0.21662 – cycle top targets
🎯 Potential Upside: 200% – 1000%+
📈 Trend Reversal Confirmed: Once weekly higher-highs are established
⚠️ Bearish Scenario (RISK MANAGEMENT):
Breakdown below 0.01800 could trigger:
0.01200 (intermediate support)
0.00700 – 0.00446 (macro-level supports)
❗️Bearish Bias Valid: On weekly close below 0.01700 with strong selling volume
🧭 Conclusion:
> ANKR is currently at a critical macro support zone with a technically sound reversal setup.
For swing traders and mid-term investors, this is a strategic area to monitor for potential trend shift.
Tight risk, massive reward.
📌 Strategy Recommendation:
Use DCA (dollar-cost averaging) in the demand zone
Place conservative stop-loss below 0.01700
Watch for breakout with volume above 0.02437 to confirm bullish reversal
#ANKR #ANKRUSDT #CryptoReversal #AltcoinSetup #WeeklyChart #SwingTrade #AccumulationZone #TechnicalAnalysis #LowCapAltcoin #FibonacciTargets
✅ Get Free Signals! Join Our Telegram Channel Here: t.me/TheCryptoNuclear
✅ Twitter: twitter.com/crypto_nuclear
✅ Join Bybit : partner.bybit.com/b/nuclearvip
✅ Benefits : Lifetime Trading Fee Discount -50%
✅ Twitter: twitter.com/crypto_nuclear
✅ Join Bybit : partner.bybit.com/b/nuclearvip
✅ Benefits : Lifetime Trading Fee Discount -50%
免責聲明
這些資訊和出版物並不意味著也不構成TradingView提供或認可的金融、投資、交易或其他類型的意見或建議。請在使用條款閱讀更多資訊。