Here is the top-down analysis for ARB as requested 🫡
Weekly Timeframe:
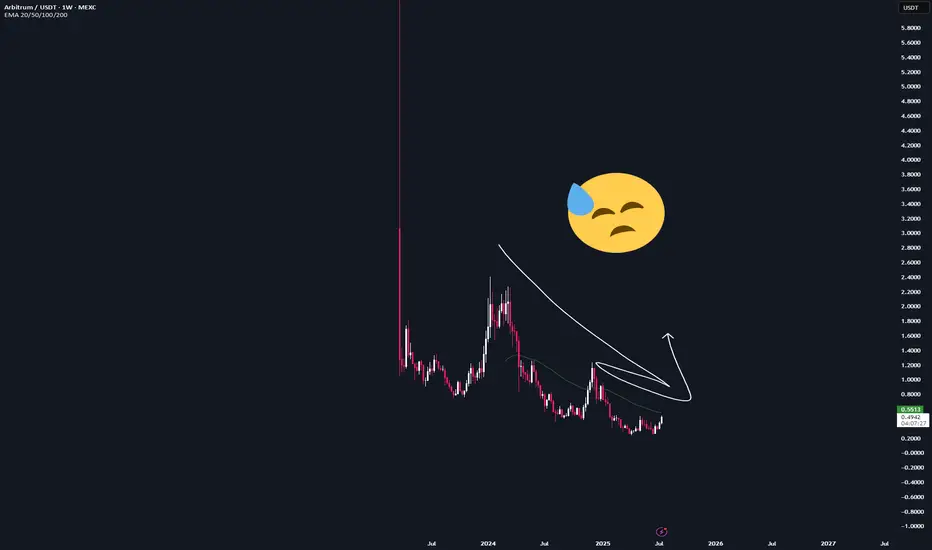
There are currently no valid bullish structures on the weekly chart, as ARB has put in lower lows.
So we have no clear targets from a weekly perspective at this point.

Daily Chart:
A new bullish sequence was just activated with the break of the recent high at $0.505, targeting the $0.67–0.77 region.
This strongly suggests that the cycle low forARB is likely in.
Every pullback into the B–C correction zone (Fib 0.5–0.667) is a potential long opportunity, and I plan to take it if we revisit that area.
I will place 4 long orders, each with a stop-loss just below the next level.

There is currently nothing interesting happening on the lower timeframes.
--------
Thats the my full Analysis forARB, hope it was helpful if yall have anymore questions feel free to ask, and if you want me to do another analysis for any other pair just comment down below.
Thanks for reading❤️
Weekly Timeframe:
There are currently no valid bullish structures on the weekly chart, as
So we have no clear targets from a weekly perspective at this point.
Daily Chart:
A new bullish sequence was just activated with the break of the recent high at $0.505, targeting the $0.67–0.77 region.
This strongly suggests that the cycle low for
Every pullback into the B–C correction zone (Fib 0.5–0.667) is a potential long opportunity, and I plan to take it if we revisit that area.
I will place 4 long orders, each with a stop-loss just below the next level.
There is currently nothing interesting happening on the lower timeframes.
--------
Thats the my full Analysis for
Thanks for reading❤️
免責聲明
這些資訊和出版物並不意味著也不構成TradingView提供或認可的金融、投資、交易或其他類型的意見或建議。請在使用條款閱讀更多資訊。
免責聲明
這些資訊和出版物並不意味著也不構成TradingView提供或認可的金融、投資、交易或其他類型的意見或建議。請在使用條款閱讀更多資訊。