📊 Technical Analysis (Daily Timeframe)
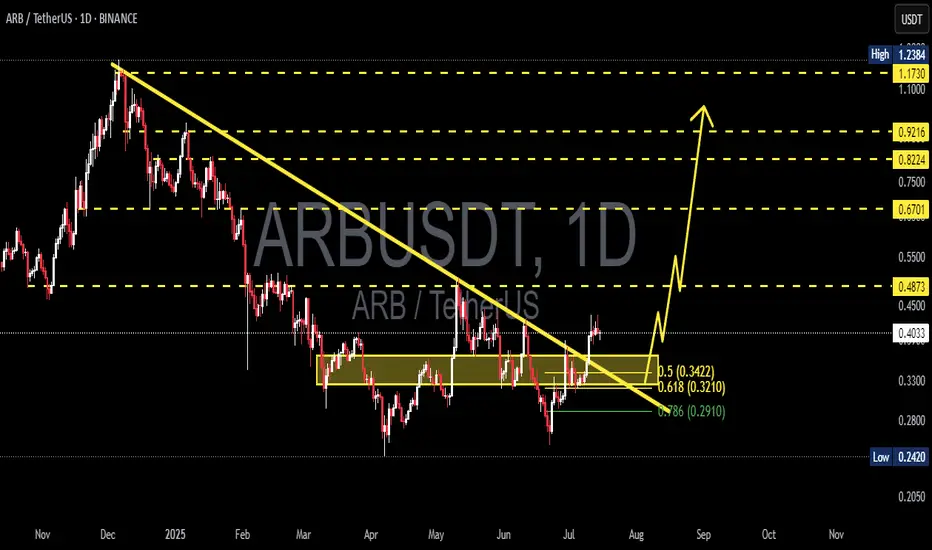
ARB has officially broken out of a long-standing descending trendline that has defined its downtrend since late 2024. This breakout, supported by strong demand at key Fibonacci levels, could be the start of a major bullish reversal.
🧠 Key Chart Patterns & Structure:
🔸 Descending Triangle Breakout
Originally viewed as bearish, this triangle has instead resolved to the upside — a rare but powerful bullish reversal signal when paired with growing volume and price compression near the breakout.
🔸 Fib Retracement Bounce
Price rebounded precisely from the 0.618 (0.3210) and 0.786 (0.2910) levels, confirming these zones as strong accumulation and liquidity areas.
🔸 Break & Retest Zone at 0.3422 – 0.3210
This golden zone will be key for confirming the breakout. A successful retest here sets the stage for the next leg up.
🔸 Bullish Price Structure Formation
A potential higher low and higher high formation is beginning, which would fully confirm the shift from bearish to bullish market structure.
🟢 Bullish Scenario (High Probability)
If the breakout is validated with a successful retest of the zone:
✅ Short-term Targets:
0.4873 — First major resistance
0.6701 — Mid-range zone with historical confluence
🚀 Mid to Long-Term Targets:
0.8224
0.9216
1.1730
1.2384 — Full recovery back to former highs
🔼 These zones align with Fibonacci extensions and historical resistance areas. Bull momentum can accelerate quickly due to short covering and new buyers entering.
🔴 Bearish Scenario (Invalidation Level)
If price fails to hold above 0.3210, the bullish setup is invalidated short-term:
Breakdown could revisit 0.2910 (Fib 0.786 support)
Below that: full retrace to the December–March demand base at 0.2420
🛑 Key Invalidation Level: Break below 0.3210 with strong selling pressure.
📌 Strategic Summary
ARB has broken its macro downtrend, signaling the start of a new phase.
Holding above the golden pocket zone (0.3210–0.3422) is critical for continuation.
Targets above 0.9–1.2 are realistic if the market sustains its momentum.
Monitor volume and RSI for further confirmation of bullish strength.
🔍 Traders Note:
This setup reflects an ideal blend of trend reversal, Fibonacci support, and breakout confirmation — a textbook setup for swing and positional traders aiming for medium-term upside.
#ARB #ARBUSDT #BreakoutAlert #CryptoTA #TrendReversal #BullishSetup #TechnicalAnalysis #CryptoTrading #FibonacciLevels #DescendingTriangle #AltcoinBreakoutl
✅ Get Free Signals! Join Our Telegram Channel Here: t.me/TheCryptoNuclear
✅ Twitter: twitter.com/crypto_nuclear
✅ Join Bybit : partner.bybit.com/b/nuclearvip
✅ Benefits : Lifetime Trading Fee Discount -50%
✅ Twitter: twitter.com/crypto_nuclear
✅ Join Bybit : partner.bybit.com/b/nuclearvip
✅ Benefits : Lifetime Trading Fee Discount -50%
免責聲明
這些資訊和出版物並不意味著也不構成TradingView提供或認可的金融、投資、交易或其他類型的意見或建議。請在使用條款閱讀更多資訊。