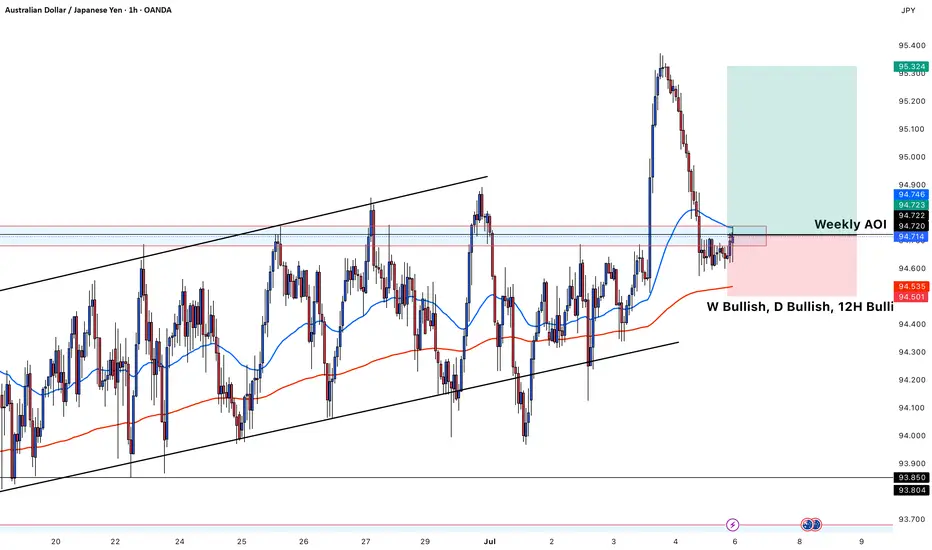
This chart shows a **buy setup on AUD/JPY** based on multi-timeframe bullish confluence and a key structure level. Here's a breakdown of the idea:
---
### 🟢 **Trade Type:** Buy
### 📈 Pair: AUD/JPY (1H Chart)
---
### ✅ **Technical Confluences:**
* **Trend Bias:**
* **Weekly (W): Bullish**
* **Daily (D): Bullish**
* **12H: Bullish**
* **Structure:**
* Price retraced into a **Weekly Area of Interest (AOI)** marked in blue and red zone.
* It bounced off the lower trendline of the ascending channel.
* Price is currently forming higher lows near the support of the AOI.
* **Indicators:**
* The **50 EMA (blue)** and **200 EMA (red)** are holding as dynamic support, especially the 200 EMA just below current price.
* EMAs show bullish alignment (short-term EMA above long-term EMA).
* **Candle Action:**
* Price rejected the AOI and is trying to push higher.
* The bullish engulfing near the EMA zone confirms buy interest.
---
### 🟦 **Entry Zone:**
* Around **94.70–94.72**, aligned with the Weekly AOI and just above 200 EMA.
### 📍 Stop Loss:
* Below the red support zone, around **94.50–94.53**, under 200 EMA and key rejection wick.
### 🎯 Take Profit:
* Around **95.30–95.32**, targeting the previous swing high for a favorable risk-reward ratio.
---
### 📊 Summary:
This is a bullish continuation trade, buying from a retracement into a strong support zone with higher timeframe bullish structure and clear confirmation through price action and EMA alignment.
---
### 🟢 **Trade Type:** Buy
### 📈 Pair: AUD/JPY (1H Chart)
---
### ✅ **Technical Confluences:**
* **Trend Bias:**
* **Weekly (W): Bullish**
* **Daily (D): Bullish**
* **12H: Bullish**
* **Structure:**
* Price retraced into a **Weekly Area of Interest (AOI)** marked in blue and red zone.
* It bounced off the lower trendline of the ascending channel.
* Price is currently forming higher lows near the support of the AOI.
* **Indicators:**
* The **50 EMA (blue)** and **200 EMA (red)** are holding as dynamic support, especially the 200 EMA just below current price.
* EMAs show bullish alignment (short-term EMA above long-term EMA).
* **Candle Action:**
* Price rejected the AOI and is trying to push higher.
* The bullish engulfing near the EMA zone confirms buy interest.
---
### 🟦 **Entry Zone:**
* Around **94.70–94.72**, aligned with the Weekly AOI and just above 200 EMA.
### 📍 Stop Loss:
* Below the red support zone, around **94.50–94.53**, under 200 EMA and key rejection wick.
### 🎯 Take Profit:
* Around **95.30–95.32**, targeting the previous swing high for a favorable risk-reward ratio.
---
### 📊 Summary:
This is a bullish continuation trade, buying from a retracement into a strong support zone with higher timeframe bullish structure and clear confirmation through price action and EMA alignment.
免責聲明
這些資訊和出版物並不意味著也不構成TradingView提供或認可的金融、投資、交易或其他類型的意見或建議。請在使用條款閱讀更多資訊。
免責聲明
這些資訊和出版物並不意味著也不構成TradingView提供或認可的金融、投資、交易或其他類型的意見或建議。請在使用條款閱讀更多資訊。