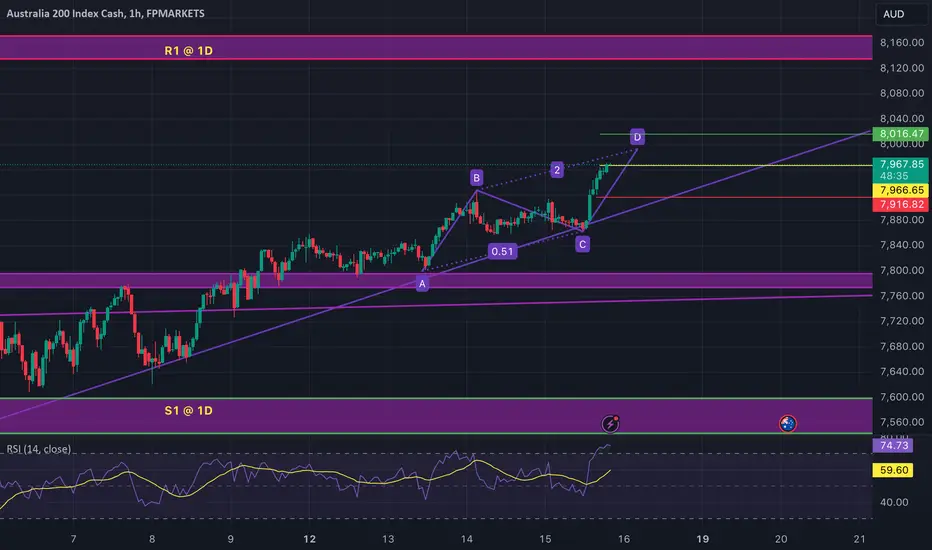
This index is bullish on a daily time frame and a resistance and support level are drawn (purple rectangle). The bullish trend is also denoted by a purple trend line. There was a divergence on 1D time frame which resulted in a downward trend for few days but after that it again got back in bullish trend. On hourly chart there was a bullish diversion which reversed the trend back to bullish which can been seen from daily time frame. A trend line is also drawn on an hourly chart along with an ABCD bearish reversal harmonic. Currently there is no divergence on a hourly chart but there is one on 15m that would result in a form of correction in the trend on hourly chart. I have placed my order of Buy Stop on 15m time frame because the probability is high for an upward trend till it test the 1D resistance level.
The Signal is:
EP: 7966.60
SL: 7916.80
TP: 8016.40
RR: 0.25%
The Signal is:
EP: 7966.60
SL: 7916.80
TP: 8016.40
RR: 0.25%
免責聲明
這些資訊和出版物並不意味著也不構成TradingView提供或認可的金融、投資、交易或其他類型的意見或建議。請在使用條款閱讀更多資訊。
免責聲明
這些資訊和出版物並不意味著也不構成TradingView提供或認可的金融、投資、交易或其他類型的意見或建議。請在使用條款閱讀更多資訊。