Boeing Company (The)
已更新

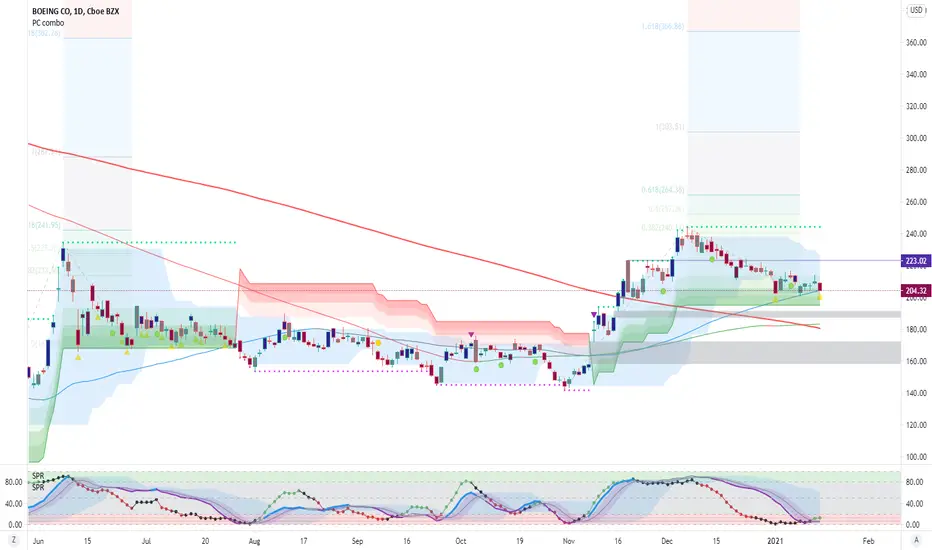
Trading it back to it previous ATH

57
This is a volatile stock! Be careful with entry; start a trade with a put credit spread and call debit spread;
Its seasonality during the Obama presidency
Its TipRanks
註釋
high probability that it drops to 190/195 to establish a short-term trading range of 190/195 - 220/225
註釋
$215 is the resistance in its 2hr chart. 快照
註釋
the gap at 190 is supporting BA this week.
快照
註釋
reviewing its wkly chart: the gap at 160 is a strong support.
快照
註釋
Its daily chart illustrates a short-term trading range from 190 to 210.
快照
註釋
its 2hr chart: 快照
註釋
after BA enters the 210/215 zone, it may pullback. 快照
註釋
I think I got the pullback I waited for; it's time to trade to $225.
快照
註釋
after BA crossed above my previous target 225, I decided to use its 24hr chart along with a Fibonacci fan to track its pullback and the next target -> $225.
快照

免責聲明

這些資訊和出版物並不意味著也不構成TradingView提供或認可的金融、投資、交易或其他類型的意見或建議。請在使用條款閱讀更多資訊。