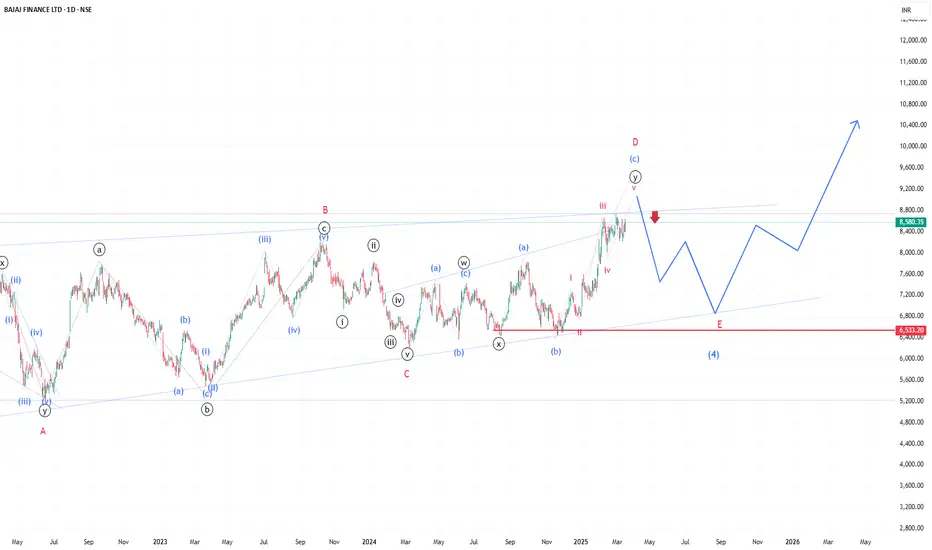
🔹 Key Observations:
✅ Triangle Formation: Price action is consolidating within a contracting structure.
✅ Wave (d) Completion? Price has touched the upper boundary, signaling a possible correction.
✅ Wave (e) Drop? A move towards ₹6,533 would complete the correction before a bullish leg up.
✅ Upside Target: A breakout from the triangle could lead to a strong rally beyond ₹9,000.
🔹 Strategy:
📉 Short-term: Watching for a potential dip towards Wave (e) for a buying opportunity.
📈 Long-term: Bullish bias remains intact if the structure holds.
🚨 Disclaimer: This is my personal analysis, and I may be completely wrong. This is for educational purposes only and should not be considered financial advice. Please conduct your own research before making any trading decisions. I am not a SEBI-registered analyst.
免責聲明
這些資訊和出版物並不意味著也不構成TradingView提供或認可的金融、投資、交易或其他類型的意見或建議。請在使用條款閱讀更多資訊。
免責聲明
這些資訊和出版物並不意味著也不構成TradingView提供或認可的金融、投資、交易或其他類型的意見或建議。請在使用條款閱讀更多資訊。