Monday’s session saw BankNifty opening with a gap-up, hitting a high of 48,574.70, but it couldn’t hold and dropped to a low of 47,841.30. However, it recovered slightly and closed at 48,114.30, losing 230 points from the previous close. Both the Weekly Trend (50 SMA) and Daily Trend (50 SMA) remain negative.
Demand/Support Zones
Near Support: Around 47,850 (Triple Bottom on Daily Chart)
Far Support: 46,077.85 (Low of 4th June 2024)
Far Demand/Support Zone (Daily): 44,633.85 - 45,750.40
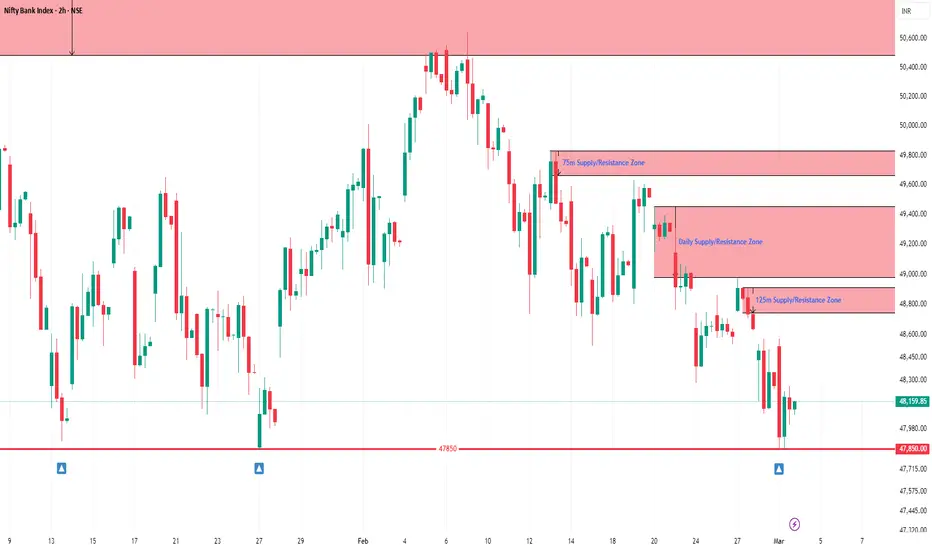
Supply/Resistance Zones
Near Supply/Resistance Zone (125m): 48,743.80 - 48,911.90
Near Supply/Resistance Zone (Daily): 48,981.20 - 49,455.80
Far Supply/Resistance Zone (75m): 49,665.95 - 49,829.40
Far Supply/Resistance Zone (Weekly): 50,485.05 - 51,979.75 (Tested)
Outlook
BankNifty has dropped 6,626 points (12%) in the last 5 months from its All-Time High of 54,467.35. Today’s low of 47,841.30 is very close to the previous lows on 13th Jan 2025 (47,898.35) and 27th Jan 2025 (47,844.15), forming a potential Triple Bottom around 47,850. The index closed above 48,000, which could indicate a short-term bounce if the support holds. However, multiple supply zones above suggest strong selling pressure at higher levels. Any upside move may face resistance, making a Sell-on-Rise strategy more favorable until a breakout is confirmed.
Demand/Support Zones
Near Support: Around 47,850 (Triple Bottom on Daily Chart)
Far Support: 46,077.85 (Low of 4th June 2024)
Far Demand/Support Zone (Daily): 44,633.85 - 45,750.40
Supply/Resistance Zones
Near Supply/Resistance Zone (125m): 48,743.80 - 48,911.90
Near Supply/Resistance Zone (Daily): 48,981.20 - 49,455.80
Far Supply/Resistance Zone (75m): 49,665.95 - 49,829.40
Far Supply/Resistance Zone (Weekly): 50,485.05 - 51,979.75 (Tested)
Outlook
BankNifty has dropped 6,626 points (12%) in the last 5 months from its All-Time High of 54,467.35. Today’s low of 47,841.30 is very close to the previous lows on 13th Jan 2025 (47,898.35) and 27th Jan 2025 (47,844.15), forming a potential Triple Bottom around 47,850. The index closed above 48,000, which could indicate a short-term bounce if the support holds. However, multiple supply zones above suggest strong selling pressure at higher levels. Any upside move may face resistance, making a Sell-on-Rise strategy more favorable until a breakout is confirmed.
免責聲明
這些資訊和出版物並不意味著也不構成TradingView提供或認可的金融、投資、交易或其他類型的意見或建議。請在使用條款閱讀更多資訊。