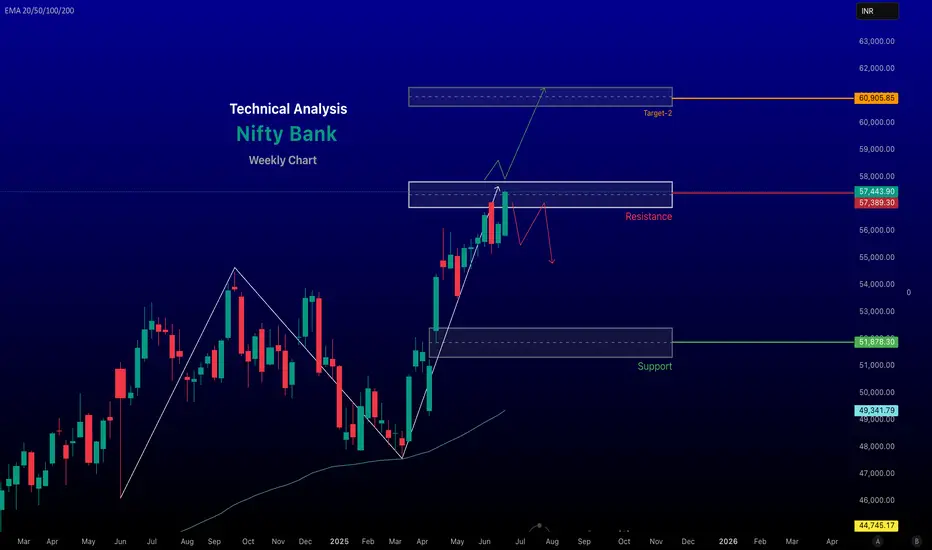
The Bank Nifty index, as of June 28, 2025, shows a bullish outlook based on recent market data and technical analysis, though traders should remain cautious due to potential volatility and resistance levels. Here's a detailed analysis for today:
Market Performance and Sentiment
Recent Performance: The Nifty Bank index closed at 57,443.90 on June 27, 2025, with a gain of 237.20 points (+0.41%), indicating continued bullish momentum. The index has been trading near its 52-week high of 57,475.40, reflecting strong sectoral leadership. Posts on X suggest that Bank Nifty has outperformed the Nifty 50, which is 2.5% below its all-time high, with a target of 59,000.
Market Sentiment: Positive global cues, including a ceasefire between Israel and Iran, falling crude oil prices, and dovish signals from the U.S. Federal Reserve, have boosted risk appetite, supporting the banking sector's rally. Foreign Institutional Investors (FIIs) have been net buyers for four consecutive months, further fueling bullish sentiment. However, significant open interest (OI) buildup in the last two days suggests potential for abnormal volatility in the near term.
~~~ Technical Analysis ~~~
Current Levels and Trends: The index is closing at around 57,443.90, with a gain of 0.41%. The advance/decline ratio is positive at 8:4, indicating broader participation in the uptrend. The index is trading above key exponential moving averages (20-day, 50-day, and 200-day EMAs), confirming a strong upward trend on the weekly timeframe.
# Support and Resistance:
Support: Strong support is noted around 57,000, which has held well in recent sessions. A break below this could drag the index to 56,400–56,000. Additional support lies at 55,500, a critical level for maintaining bullish bias.
Resistance: Immediate resistance is at 57,500–57,800. A decisive break above 57,800 could push the index toward 58,000–58,400. Call options at 56,500 and 57,000 show significant open interest, reinforcing these as key resistance levels.
Technical Indicators: The Relative Strength Index (RSI) on the weekly timeframe is at 67.31, showing a reversal toward the upside, indicating strengthening momentum. However, a bearish divergence on the 4-hour chart remains unresolved, suggesting a potential correction toward 52,000 if the bullish structure weakens.
-- Bullish trend, next target 61,000 if we break and close above 57,800 on weekly timeframe --
Chart for reference.
- Disclaimer --
This analysis is based on recent technical data and market sentiment from web sources. It is for informational purposes only and not financial advice. Trading involves high risks, and past performance does not guarantee future results. Always conduct your own research or consult a SEBI-registered advisor before trading.
#Boost and comment will be highly appreciated
renderwithme
免責聲明
這些資訊和出版物並非旨在提供,也不構成TradingView提供或認可的任何形式的財務、投資、交易或其他類型的建議或推薦。請閱讀使用條款以了解更多資訊。
renderwithme
免責聲明
這些資訊和出版物並非旨在提供,也不構成TradingView提供或認可的任何形式的財務、投資、交易或其他類型的建議或推薦。請閱讀使用條款以了解更多資訊。
