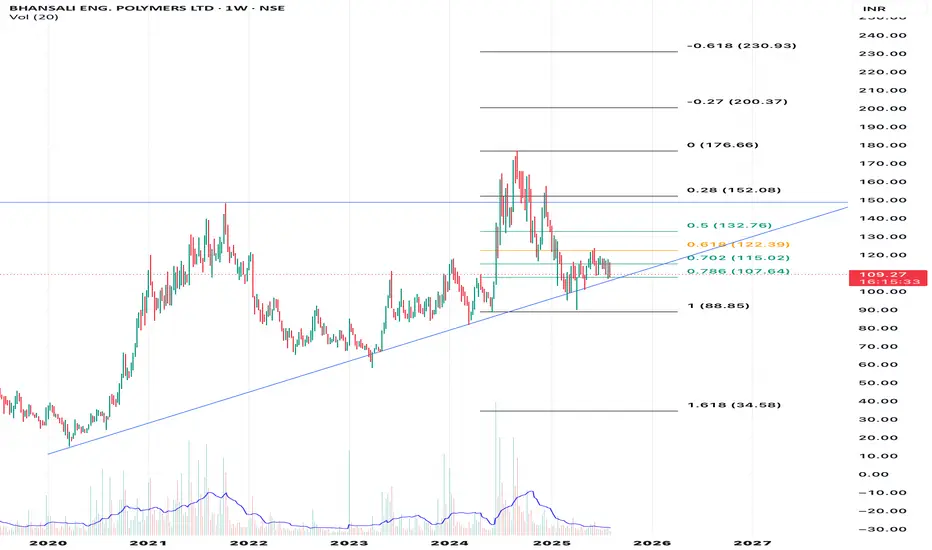
Weekly chart of Bhansali Engineering Polymers Ltd (BEPL) on NSE

🔍 Technical Analysis Summary
1. Current Price & Trend
• Current Price: ₹109.27
• Price Action:
• Price is sitting just above the 0.786 Fibonacci level (~₹107.64).
• It has pulled back from recent highs near ₹152.
• Currently hovering near the ascending trendline support from the 2020 lows.
⸻
2. Support & Resistance Levels
📉 Support Levels
• Trendline Support: Rising trendline from 2020 (~₹107–₹110 range).
• Fibonacci Support Levels:
• 0.786 Fib: ₹107.64 ✅ (Currently acting as support)
• 1.000 Fib: ₹88.85 (Major support if breakdown occurs)
📈 Resistance Levels
• Immediate Resistance:
• 0.702 Fib: ₹115.02
• 0.618 Fib: ₹122.39
• 0.5 Fib: ₹132.76
• Major Resistance:
• ₹152.08 (0.28 Fib) – previous swing high
⸻
3. Chart Patterns
• Symmetrical Triangle / Ascending Triangle Formation:
• Price is coiling within a tightening range between horizontal resistance and rising trendline.
• A breakout above ₹122–₹132 could indicate bullish continuation.
• Breakdown below ₹107 and especially ₹88.85 may trigger bearish momentum.
⸻
4. Volume Analysis
• Volume is relatively subdued recently.
• Previous price surges have been supported by spikes in volume — important to watch for volume breakout confirmation.
⸻
🧭 Possible Scenarios
✅ Bullish Scenario
• Hold above ₹107 support and break above ₹115–₹122 zone.
• Target: ₹132 (0.5 Fib) → ₹152 (swing high) → ₹176 → ₹200+
❌ Bearish Scenario
• Breakdown below ₹107 with volume.
• Breakdown of trendline → ₹88.85 (strong horizontal + Fib support)
• Deeper downside if ₹88 breaks → ₹34.58 (1.618 Fib extension)
⸻
🧠 Final Thoughts
• The chart is at a make-or-break zone, testing strong confluence of support (Fib 0.786 + rising trendline).
• Traders may watch ₹107 closely for support.
• Investors should keep an eye on a breakout above ₹122 with volume for potential re-entry.
免責聲明
這些資訊和出版物並非旨在提供,也不構成TradingView提供或認可的任何形式的財務、投資、交易或其他類型的建議或推薦。請閱讀使用條款以了解更多資訊。
免責聲明
這些資訊和出版物並非旨在提供,也不構成TradingView提供或認可的任何形式的財務、投資、交易或其他類型的建議或推薦。請閱讀使用條款以了解更多資訊。