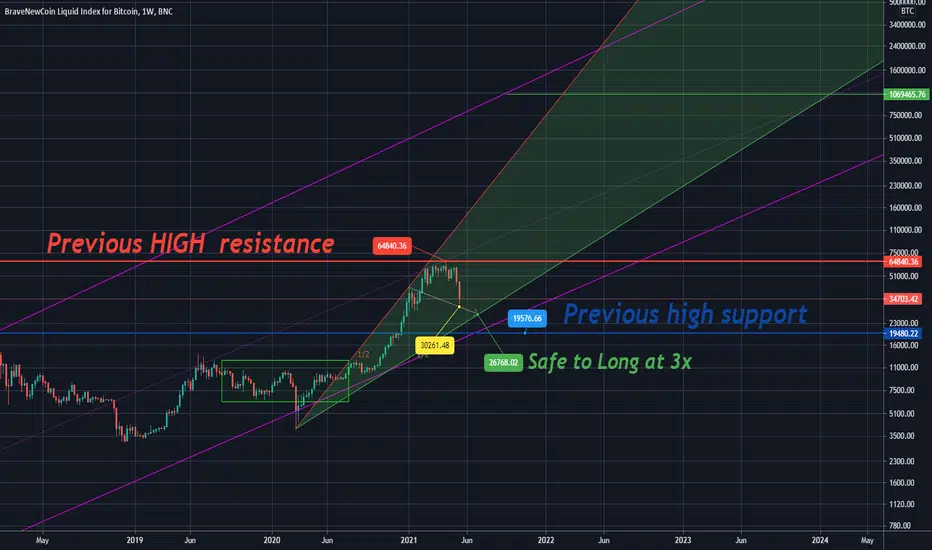
Simple chart:
The Green are represents this Cycle Top & Cycle Bottoms.
Long when the price hits the GREEN line,
Short when the price hits the RED line
The Green are represents this Cycle Top & Cycle Bottoms.
Long when the price hits the GREEN line,
Short when the price hits the RED line
免責聲明
這些資訊和出版物並不意味著也不構成TradingView提供或認可的金融、投資、交易或其他類型的意見或建議。請在使用條款閱讀更多資訊。