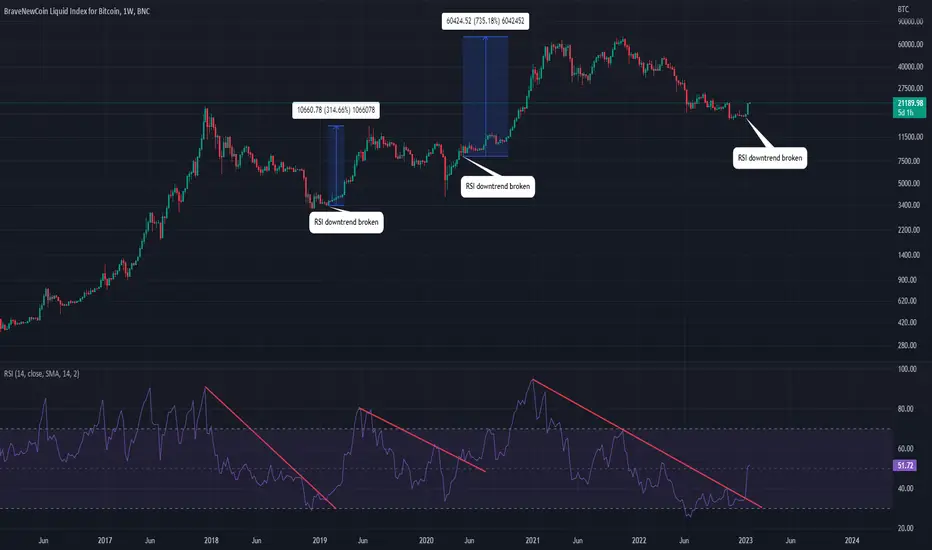
BTC has just recently breached its 2 year downtrend on the RSI. This is a very bullish indicator for the longer term. If we look back at 2018 we can see the RSI had a similar downwards sloping trendline that when broken led to a 300%+ pump. The second time this happened was during 2020. We had our downwards sloping trendline, broke above it and flipped it into new support before going on a 750%+ rally. Current day, we have just broken our downwards sloping trendline and have already almost pumped 40%. This does not mean we cannot have a retracement in the short term, but from a weekly perspective the bottom looks like it is in!
免責聲明
這些資訊和出版物並不意味著也不構成TradingView提供或認可的金融、投資、交易或其他類型的意見或建議。請在使用條款閱讀更多資訊。