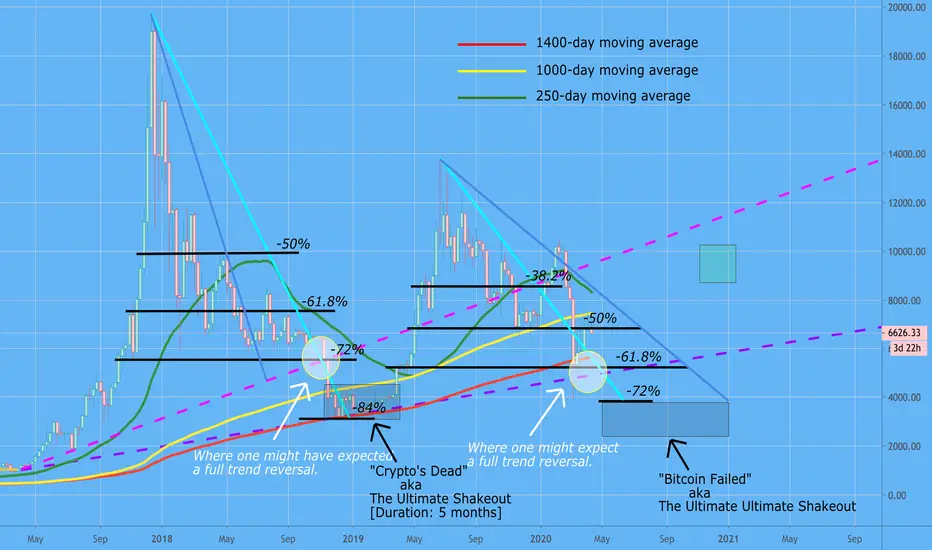
This is a chart I put together back in November 2019, but I can't prove it except by that green box I drew. If you want to learn more about the theory behind this chart, check out 'Hyperwave Theory' by the two Tylers and Leah. These people are smart AF.
I originally titled this chart, "Why $4k is my sell zone." Obviously no one could have possibly had any idea we could swing down to $3.9k, and we didn't stay there long at all. I still can't decide if that will turn out to be the low or not.
I originally titled this chart, "Why $4k is my sell zone." Obviously no one could have possibly had any idea we could swing down to $3.9k, and we didn't stay there long at all. I still can't decide if that will turn out to be the low or not.
免責聲明
這些資訊和出版物並不意味著也不構成TradingView提供或認可的金融、投資、交易或其他類型的意見或建議。請在使用條款閱讀更多資訊。
免責聲明
這些資訊和出版物並不意味著也不構成TradingView提供或認可的金融、投資、交易或其他類型的意見或建議。請在使用條款閱讀更多資訊。